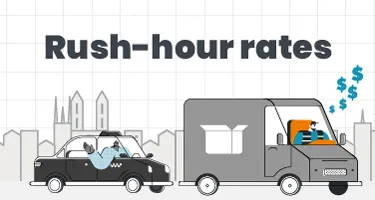
Motoring expenses are shark-like in their stealth. You may be wary of the cost of owning a car and fuel consumption. But that’s just the fin of the shark.
The teeth are hidden underwater. A new car loses 10-20% of its value every year. The average cost of unexpected repairs is $1,128. And the toll on the environment is beyond mere dollars and cents.
But there’s more: what about all the other sharks swimming around you? Time wasted in traffic is rarely a consideration when totting up motor expenses. Yet, rush-hour congestion drains fuel, time, and productivity. We calculated the average annual cost of rush-hour traffic worldwide to be $1,343 per motorist.
Budget Direct commissioned Neomam Studios to find out the number of hours wasted in traffic each year in 418 global cities. We multiplied these figures by 50% of the average local pay to calculate the dollar cost of lost productivity (based on a study by INRIX that showed every hour in traffic results in 30 minutes loss in productivity). We also used local fuel prices to calculate the cost of extra fuel needed to drive the local average amount of time spent in rush-hour traffic.
The result is Budget Direct’s guide to the cost of rush-hour traffic in Australian dollars to motorists around the world.
Key Findings
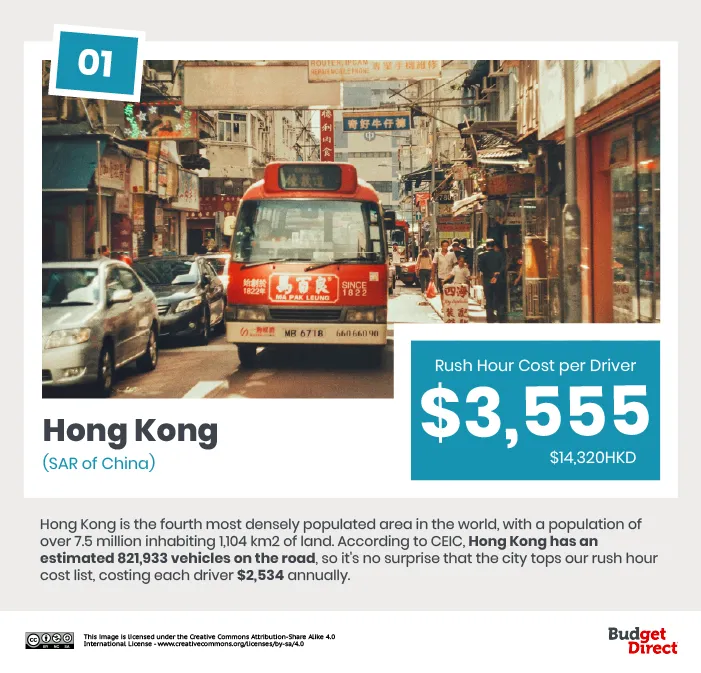
- Hong Kong is the city where rush hour costs motorists the most: $3,555 per year ($2,054 in lost income and $1,501 in extra fuel costs).
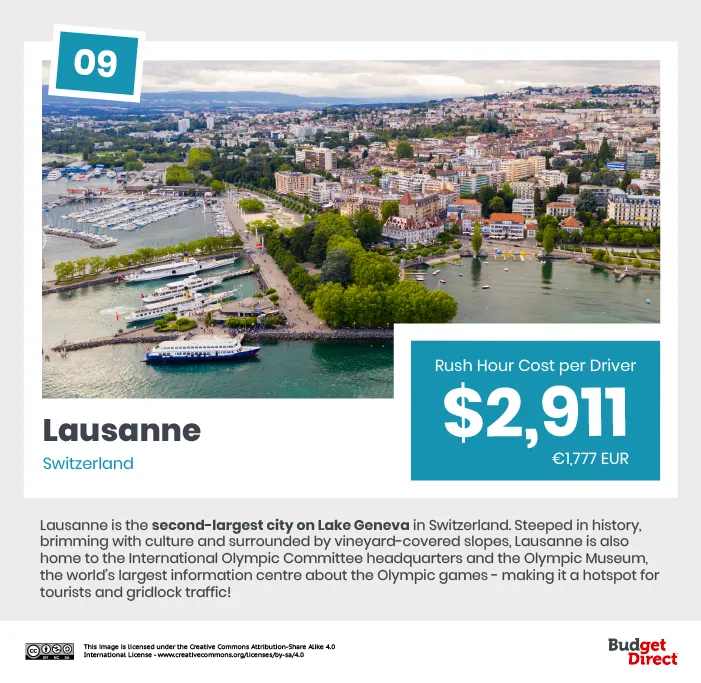
- The Swiss cities of Geneva and Zurich are where motorists lose the most income due to being stuck in traffic: $2,459 per year.
- The Australian city with the highest rush hour costs is Sydney ($2,331 per year).
- LA is the US city with the highest rush hour costs ($2,548 per year).
- Edinburgh is the UK city with the highest costs ($2,381 per year).
Rush-Hour Delays Cost Hong Kong Motorists $3,555 Per Year
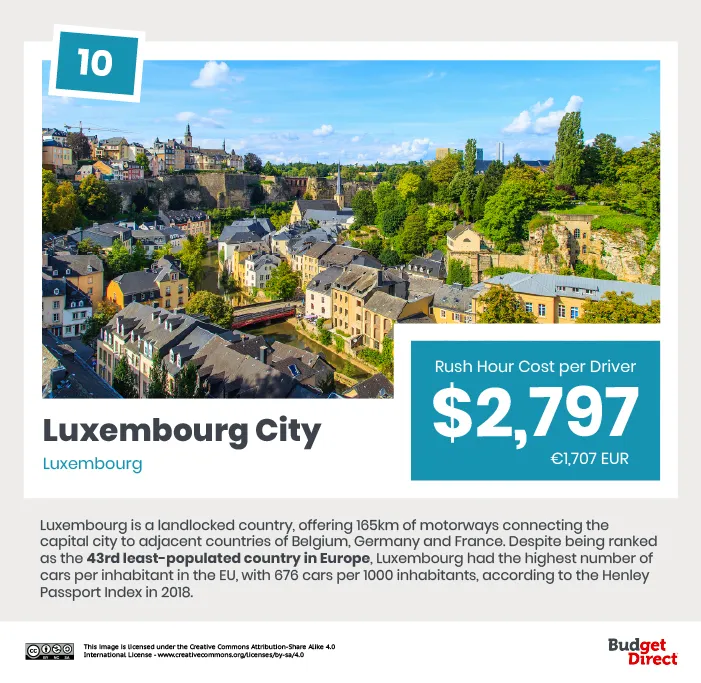
Budget Direct found the average rush-hour delay, wage, and fuel cost for 418 cities worldwide and used them to calculate the average annual cost of rush-hour delays per motorist. We found that nine out of the top ten cities are European – but the world number one is the city of Hong Kong, known for the highest fuel prices in the world.
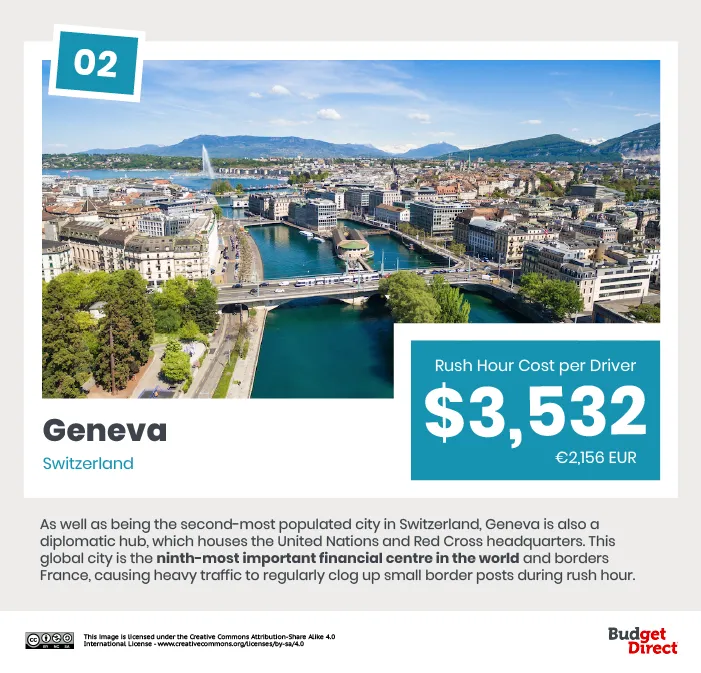
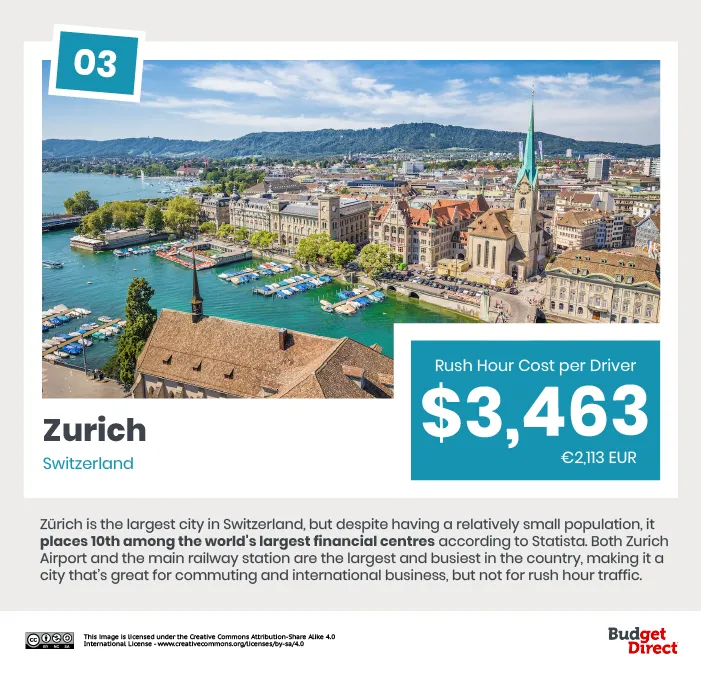
Swiss cities make up half of the global top ten. Switzerland has the highest national income per capita in the word, so time spent in traffic makes for a big hourly loss.
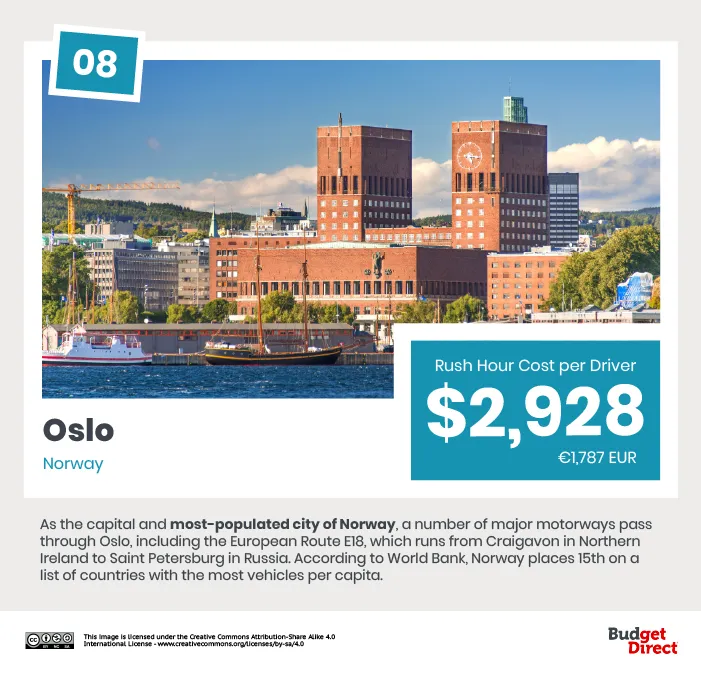
Oslo, Norway’s capital, also features in the top ten. Norway has the fifth-highest fuel costs in the world and is number seven for wages. However, electric cars now outsell fossil-fuelled cars in Norway. While the Norwegian petrol motorist loses $2,928 per year in traffic, including $934 in extra fuel, they could save around $723 by switching to electric (given that charging costs may be as low as 20% of petrol costs).
Sydney’s Motorists Pay $2,331/Year to Sit in Traffic
Sydney has Australia’s most congested roads, and the city’s motorists pay significantly more for the time they spend in traffic each year than anyone else: $2,331 against second-placed Hobart’s $1,889. Sydney falls just outside of the top 20 most expensive rush hours in the world.
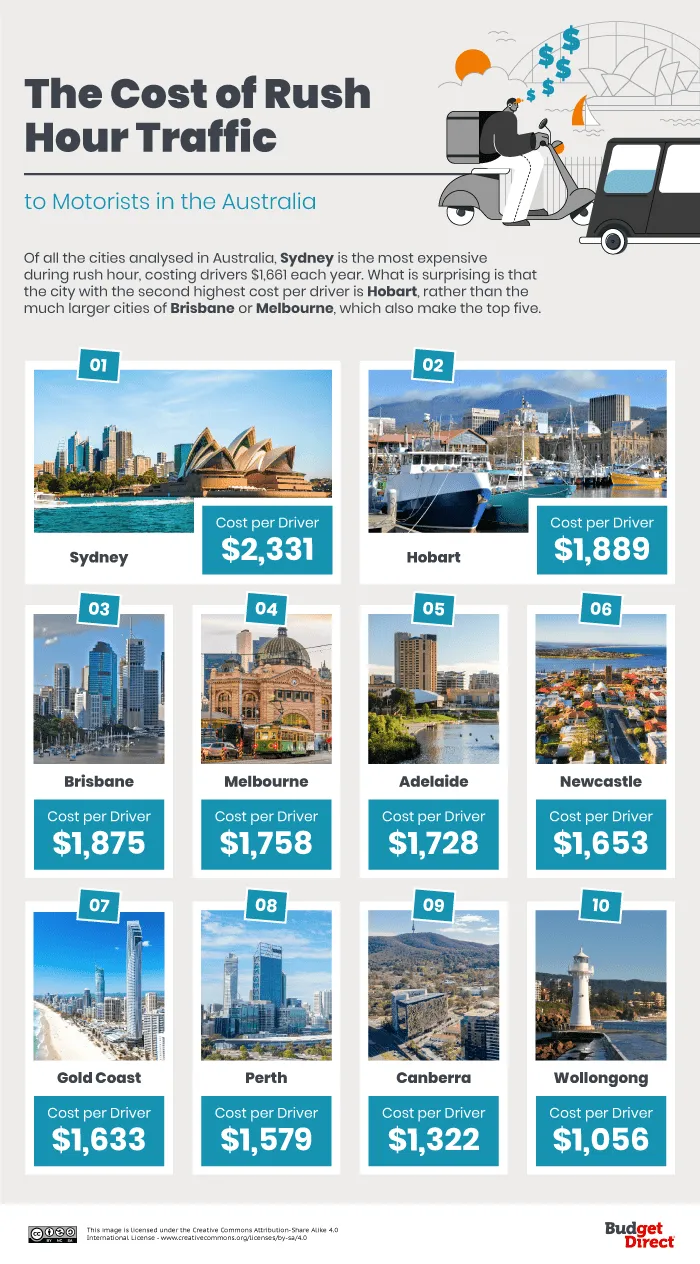
Budget Direct recently revealed that Hobart has the most expensive diesel and fourth-most expensive unleaded in the land. Our new study shows the toll this takes in traffic: Hobart’s motorists waste $661 in extra fuel stuck in traffic each year, contributing to a total cost of $1,889. Wollongong’s rush-hour premium is 45% that of Sydney’s, reflecting just 50 hours of congestion per person each year (against 112 in Sydney).
Los Angeles and New York City are the Most Expensive Places in the US to Get Stuck in Traffic
LA tops the table in the US, followed at a distance by New York City, with another substantial gap before the trailing pack. But it is not a pack you would want to lead: Los Angelenos pay $2,548 per year for the privilege of sitting in traffic jams for 101 hours each year.
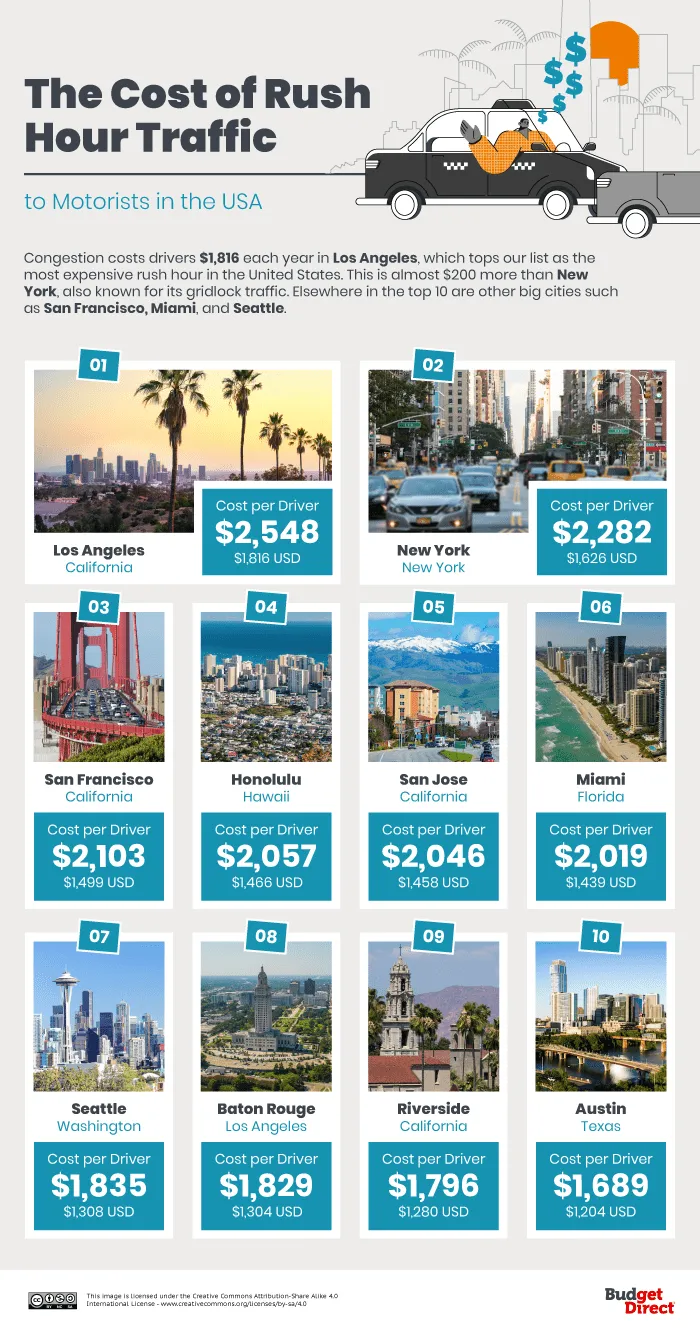
To non-Americans, it may be a surprise to see Honolulu, Hawaii, so high in the list of traffic costs. In fact, Honolulu is recognised for its terrible traffic, topping ‘most congested’ studies until recently and clocking up 82 hours of delays in a single, locked-down year.
Two UK Capital Cities Top Hidden Motoring Expenses Table: Edinburgh and London
Edinburgh just pips London to become the UK’s most costly city for rush-hour traffic. The two capitals have near-identical statistics, but the Scottish city edges it on congestion hours (119 vs. 115) and fuel costs ($2.32 vs $2.31 per litre).
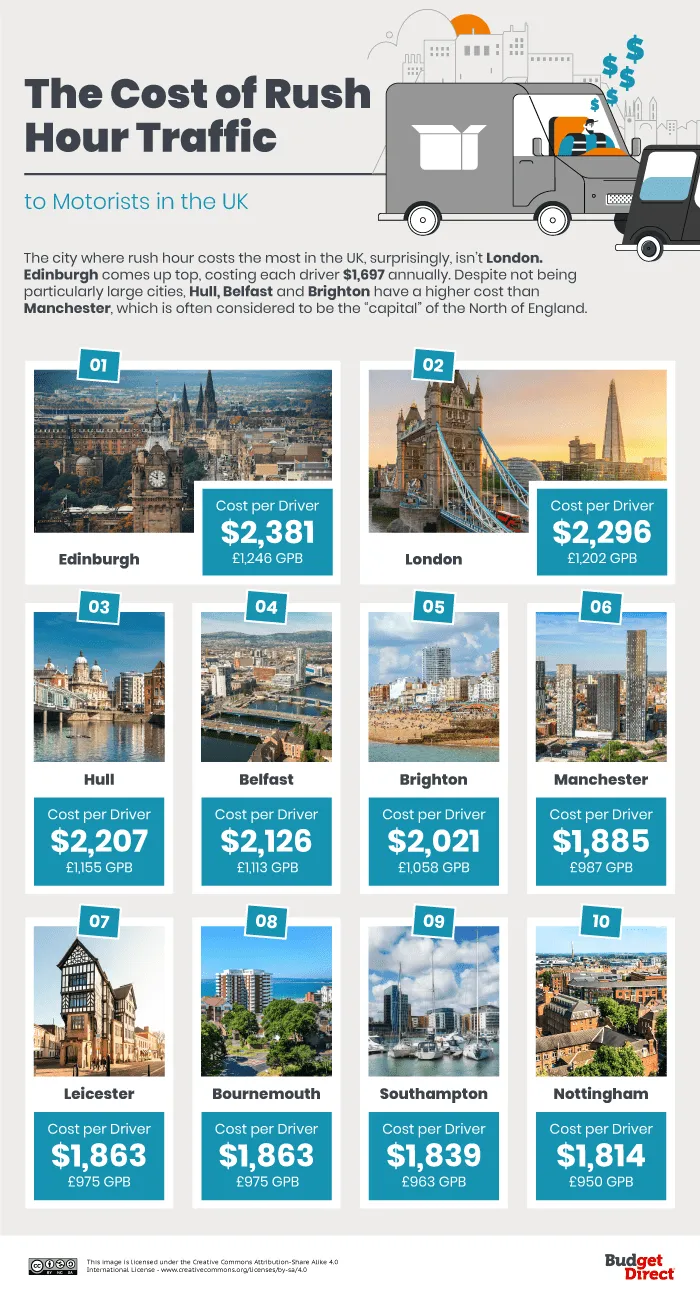
Another capital city, Belfast, takes fourth place. More surprising is the coastal city of Hull, sandwiched in third place with an annual traffic jam cost to drivers of $2,207. But Hull has the UK’s third-most congested roads, and fuel is pricier here than in any of the UK’s capital cities.
How Much Do Traffic Jams Cost Your City?
Traffic jam costs are a mighty pile-up of ingrained bad habits: poorly planned road infrastructure, an insistence on driving to work instead of cycling or public transport, and a planet-busting loyalty to fossil fuels.
But with the work-from-home and flexitime boom, the culture of commuting is in the midst of a revolution. Those who still travel to work may do so at different times. Quieter roads and emissions targets may lead to more sensible urban planning – and more sensible motoring.
In case you need to shock yourself out of the habit of snailing to work through traffic, use our interactive below to discover the annual cost of rush-hour congestion to motorists in your city. Your savings might be enough to buy a bicycle (or upgrade to an electric car…).
METHODOLOGY & SOURCES
Disclaimer: This information is general in nature only and does not constitute personal advice. Budget Direct has engaged NeoMam to conduct research on their behalf. While NeoMam Studios has endeavoured to ensure the information relied on is accurate and current, Budget Direct does not guarantee it and accepts no liability for this information.
The cost of rush-hour traffic per driver is a sum of the “value of time lost” + “extra fuel cost.” Studies show motorists place a value on their time relative to their salary and are willing to pay for a reduction in travelling time. Additional studies by CEBR show that the net effect of one hour stuck in traffic is a 30-minute loss in productivity, so we calculated the value of half the time spent in rush hour annually in each city using local salary data.
The number of hours lost to congestion was taken from TomTom’s Global Traffic Index. Hourly pay for each city was estimated on the basis of adjusted net national income per capita by the World Bank. Fuel costs in each city were estimated as the cost of extra fuel needed to drive the given amount of hours in congested traffic, given the typical fuel efficiency in the corresponding country, the assumed average speed in congested traffic of 20mph/32kmh, the associated 80% increase in fuel consumption, and the recent price of petrol in a given city (where possible) or country.
Sources
TomTom. (2021). The world has changed, traffic has changed. tomtom.com
World Bank. (2019). Adjusted net national income per capita (current US$).data.worldbank.org
Global Petrol Prices. (2021). Gasoline prices in selected cities. globalpetrolprices.com
IEA. (2017). Fuel Economy in Major Car Markets.Iea.org
INRIX. (2014). Traffic Congestion to Cost the UK Economy More Than £300 Billion Over the Next 16 Years. inrix.com
Technical University of Dresden. (2007). How Much does Traffic Congestion Increase Fuel Consumption and Emissions? Applying a Fuel Consumption Model to the NGSIM Trajectory Data. akesting.de
CEIC. (2021). Hong Kong SAR, China Number of Registered Vehicles. ceicdata.com
Statista. (2021). Leading financial centers globally as of March 2021. statista.com
Wikipedia. (2021). Global financial centres index. en.wikipedia.org
Wikipedia. (2021). European route 35. en.wikipedia.org
Mobility Exchange. (2019). Quality of living city ranking. mobilityexchange.mercer.com
World Bank. (2013). Motor vehicles (per 1,000 people). web.archive.org
Data was collected in June 2021.
See More Research