There's a newer version of this article.
Find out how common road rage acts are, how Australians express their anger on the roads, how trends have changed over time, and our potential solutions to road rage in our latest survey results.
Quick stats
- 45% of Australians surveyed have admitted to showing signs of road rage and aggression toward another road user in the previous year
- Around 72% of Australians have had another driver shout, swear, or rudely gesture at them in the previous 12 months
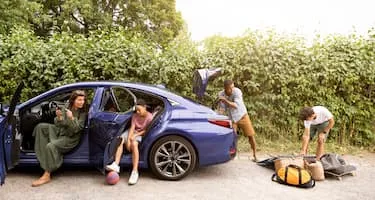
- 27% of Australians believe they drive less aggressively if they have a passenger with them in the car
- Only 22% of drivers would act less aggressively toward a car with a “Baby on Board” sticker.
One of the most common threats we face on the roads is the aggression of other motorists. Road rage is far too common, and can not only affect the mood and mindset of other motorists, it can increase the risks of damage and harm.
To truly understand the landscape of road rage in Australia, we have conducted our own research to bring you:
1.0. What counts as “road rage”
2.0. Risks of road rage
3.0. Australian road rage survey results
3.1. How often do you drive a car or motor vehicle?
3.2. When driving, which types of road rage have you experienced from another road user?
3.3. When driving, which types of road rage have you directed toward another road user?
3.4. Which of the following situations would commonly cause you to feel angry or annoyed while driving?
3.5. Do your road rage behaviours change when you have a passenger in the car with you?
3.6. Does the music you listen to affect your likelihood of acting aggressively toward other road users?
3.8. Which of these signs in cars would make you less likely to be aggressive to the driver?
3.10. Do you think the police should do more to respond urgently to complaints of road rage?
4.0. Tips for avoiding road rage
1.0 What counts as “road rage”?
Road rage will vary a little by each person’s definition, but generally, it’s the showing of aggression toward another driver. This might be done by:
In most states of Australia, road rage can often infringe on road safety laws, and could even be deemed assault[1]
- swearing
- shouting
- rudely gesturing
- threatening another road user
- harming another road user
- damaging someone else’s vehicle.
2.0. Risks of road rage
Direct damage
The consequences of a road rage incident can easily be a collision, damage to your car, or even physical harm.
Distraction
If you’re paying more attention to another motorist, that’s less attention you have on the road.
Mental well-being
Stressful situations can easily take their toll on your mental welfare. Road rage often leaves motorists rattled and upset.
3.0 Australian road rage survey results
3.1 How often do you drive a car or motor vehicle?
State
Age
Gender
Over 80% of Australians surveyed over the age of 18 drive a car or motor vehicle every week. Only around 10% never drive a motor vehicle, or drive at least less frequently than a few times a year. Western Australians had the highest rate of drivers, with almost 90% indicating they drive at least once a week.
3.2 During the past 12 months, when driving, which types of road rage have you experienced from another road user?*
State
| Shouted, cursed or made rude gestures at me | A cyclist showed aggression towards me or others with me | Intentionally hurt or threatened to hurt me or others with me | Intentionally damaged or attempted to damage the vehicle I was in | None of the above | |
|---|---|---|---|---|---|
| NSW | 78.2% | 14.9% | 10.9% | 8.9% | 13.9% |
| Vic | 75.0% | 12.0% | 6.5% | 5.4% | 19.6% |
| Qld | 69.7% | 10.1% | 2.3% | 5.6% | 22.5% |
| WA | 61.5% | 3.9% | 11.5% | 3.9% | 34.6% |
| SA | 67.7% | 12.9% | 3.2% | 6.5% | 22.6% |
| Tas | 77.8% | 11.1% | 0.0% | 0.0% | 22.2% |
| Aus | 72.6% | 11.8% | 6.7% | 6.2% | 20.5% |
Age
| Shouted, cursed or made rude gestures at me | A cyclist showed aggression towards me or others with me | Intentionally hurt or threatened to hurt me or others with me | Intentionally damaged or attempted to damage the vehicle I was in | None of the above | |
|---|---|---|---|---|---|
| 18-24 | 76.7% | 16.7% | 13.3% | 6.7% | 13.3% |
| 25-34 | 67.0% | 16.5% | 11.0% | 9.9% | 23.1% |
| 35-44 | 78.4% | 14.9% | 6.8% | 1.4% | 13.5% |
| 45-54 | 76.1% | 4.5% | 6.0% | 4.5% | 20.9% |
| 55-64 | 66.0% | 8.0% | 2.0% | 8.0% | 30.0% |
| 65+ | 73.0% | 8.9% | 0.0% | 6.7% | 20.0% |
| Total | 72.6% | 11.8% | 6.7% | 6.2% | 20.5% |
Gender
| Shouted, cursed or made rude gestures at me | A cyclist showed aggression towards me or others with me | Intentionally hurt or threatened to hurt me or others with me | Intentionally damaged or attempted to damage the vehicle I was in | None of the above | |
|---|---|---|---|---|---|
| Female | 71.6% | 10.9% | 7.1% | 6.6% | 20.8% |
| Male | 73.6% | 12.6% | 6.3% | 5.8% | 20.1% |
| Total | 72.6% | 11.8% | 6.7% | 6.2% | 20.5% |
Trend over time
| 2020 | 2021 | |
|---|---|---|
| Shouted, cursed or made rude gestures at me | 65% | 73% |
A cyclist showed aggression towards me or others with me | 36% | 12% |
Intentionally hurt or threatened to hurt me or others with me | 23% | 7% |
Intentionally damaged or attempted to damage the vehicle I was in | 21% | 6% |
*Users were able to select multiple answers, meaning values may not add up to 100%.
Over 70% of Australians surveyed have had another driver shout, swear, or rudely gesture at them while on the road in the previous 12 months. Western Australians were the least likely to have not experienced any signs of road rage, with 34% suggesting that none of the listed scenarios had happened to them in the past year.
Over time, more Australians have experienced shouting, swearing or rude gestures than they had in our 2020 survey. However, since that survey was conducted in September 2020, the rate of Australians having been intentionally hurt, harmed or threatened has decreased significantly.
3.3 During the past 12 months, when driving, which types of road rage have you directed toward another road user?*
State
| Shouted, cursed or made rude gestures at them | Intentionally hurt or threatened to hurt them or others with them | Intentionally damaged or attempted to damage the vehicle they were in | Showed aggression toward a cyclist | None of the above | |
|---|---|---|---|---|---|
| NSW | 41.6% | 5.0% | 5.9% | 4.0% | 50.5% |
| Vic | 39.1% | 3.3% | 4.4% | 4.4% | 58.7% |
| Qld | 38.2% | 2.3% | 0.0% | 2.3% | 58.4% |
| WA | 57.7% | 3.9% | 3.9% | 0.0% | 38.5% |
| SA | 35.5% | 3.2% | 3.2% | 6.5% | 58.1% |
| Tas | 33.3% | 0.0% | 0.0% | 0.0% | 66.7% |
| Aus | 40.3% | 3.4% | 3.4% | 3.4% | 55.2% |
Age
| Shouted, cursed or made rude gestures at them | Intentionally hurt or threatened to hurt them or others with them | Intentionally damaged or attempted to damage the vehicle they were in | Showed aggression toward a cyclist | None of the above | |
|---|---|---|---|---|---|
| 18-24 | 46.7% | 16.7% | 6.7% | 10.0% | 36.7% |
| 25-34 | 45.1% | 4.4% | 5.5% | 3.3% | 49.5% |
| 35-44 | 54.1% | 1.4% | 4.1% | 4.1% | 41.9% |
| 45-54 | 31.3% | 1.5% | 3.0% | 3.0% | 65.7% |
| 55-64 | 34.0% | 2.0% | 0.0% | 2.0% | 64.0% |
| 65+ | 24.4% | 0.0% | 0.0% | 0.0% | 75.6% |
| Total | 40.3% | 3.4% | 3.4% | 3.4% | 55.2% |
Gender
| Shouted, cursed or made rude gestures at them | Intentionally hurt or threatened to hurt them or others with them | Intentionally damaged or attempted to damage the vehicle they were in | Showed aggression toward a cyclist | None of the above | |
|---|---|---|---|---|---|
| Female | 41.0% | 3.3% | 3.8% | 1.6% | 54.6% |
| Male | 39.7% | 3.5% | 2.9% | 5.2% | 55.8% |
| Total | 40.3% | 3.4% | 3.4% | 3.4% | 55.2% |
Trend over time
| 2020 | 2021 | |
|---|---|---|
| Shouted, cursed or made rude gestures at them | 45% | 40% |
| Showed aggression toward a cyclist | 12% | 3% |
Intentionally hurt or threatened to hurt them or others with them | 12% | 3% |
Intentionally damaged or attempted to damage the vehicle they were in | 12% | 3% |
*Users were able to select multiple answers, meaning values may not add up to 100%.
Men and women tended to have very similar behaviours when it comes to road rage, with around 55% suggesting that they hadn’t done any of the usual signs of aggression on the roads. There was also a correlation between the likelihood of someone acting aggressively on the roads and their age, with younger drivers more likely to have committed road rage acts than older drivers.
A comparison to the results of our survey in 2020 also shows that Australian respondents are admitting to less acts of road rage than they had the previous year. This correlates to the less reported instances of road rage, shown in 3.2.
3.4 Which of the following situations would commonly cause you to feel angry or annoyed while driving?*
State
Potentially dangerous behaviour by other road users (e.g. cutting in front, tail-gating) | Direct aggression from other road users (e.g. shouting, rude gestures) | Rudeness or discourtesy from other road users (e.g. failing to indicate, not giving a ‘thank you’ wave) | Travel delays | |
|---|---|---|---|---|
| NSW | 73.9% | 60.4% | 49.4% | 23.6% |
| Vic | 78.4% | 57.6% | 51.5% | 26.0% |
| Qld | 84.1% | 57.8% | 50.0% | 23.7% |
| WA | 82.3% | 49.4% | 59.5% | 13.9% |
| SA | 77.4% | 59.3% | 33.3% | 22.2% |
| Tas | 74.1% | 59.3% | 33.3% | 22.2% |
| Aus | 78.1% | 56.8% | 51.5% | 23.7% |
Age
Potentially dangerous behaviour by other road users (e.g. cutting in front, tail-gating) | Direct aggression from other road users (e.g. shouting, rude gestures) | Rudeness or discourtesy from other road users (e.g. failing to indicate, not giving a ‘thank you’ wave) | Travel delays | |
|---|---|---|---|---|
| 18-24 | 71.8% | 52.1% | 52.1% | 38.0% |
| 25-34 | 74.3% | 58.0% | 57.5% | 26.6% |
| 35-44 | 80.0% | 60.0% | 52.3% | 24.6% |
| 45-54 | 76.6% | 50.5% | 48.9% | 21.7% |
| 55-64 | 79.8% | 56.1% | 46.2% | 23.1% |
| 65+ | 84.1% | 61.6% | 50.3% | 14.6% |
| Aus | 78.1% | 56.8% | 51.5% | 23.7% |
Gender
Potentially dangerous behaviour by other road users (e.g. cutting in front, tail-gating) | Direct aggression from other road users (e.g. shouting, rude gestures) | Rudeness or discourtesy from other road users (e.g. failing to indicate, not giving a ‘thank you’ wave) | Travel delays | |
|---|---|---|---|---|
| Female | 80.1% | 56.7% | 52.1% | 23.0% |
| Male | 75.7% | 57.0% | 50.8% | 24.5% |
| Total | 78.1% | 56.8% | 51.5% | 23.7% |
Trend over time
| 2020 | 2021 | |
|---|---|---|
Potentially dangerous behaviour by other road users | 93% | 78% |
| Direct aggression from other road users | 86% | 57% |
| Rudeness or discourtesy from other road users | 93% | 52% |
| Travel delays | 90% | 24% |
*Users were able to select multiple answers, meaning values may not add up to 100%.
People seem mostly made to feel angry or annoyed on the road by other human behaviour, such as dangerous driving, aggression, or rudeness from other motorists. Travel delays seem far less impactful on our state of mind behind the wheel.
Collectively, Tasmanians were the least irritable, based on combining the situations that make people feel angry or annoyed. On the other hand, Queensland drivers turned out to be the most irritable in Australia.
Over time, drivers seem far less irritable than they did in our September 2020 survey. This significant drop in triggers for anger might correlate to the reduced rate of road rage observed in 3.2 and 3.3.
3.5 Do your road rage behaviours change when you have a passenger in the car with you?
State
Age
Gender
Younger drivers were the most likely to change their behaviour due to having a passenger in the car, with around 41% indicating they would drive less aggressively. However, as drivers get older, their odds of changing their driving style and aggression become smaller and smaller, with over 80% of surveyed drivers aged 65 or above suggesting their aggression wouldn’t change, regardless of whether they had a passenger or not.
New South Wales and Victoria were the states also most likely to decrease their aggression on the roads with a passenger, with Tasmanians the least likely to change their behaviour.
3.6 Does the music you listen to affect your likelihood of acting aggressively toward other road users?
State
Age
Gender
Similarly to driving with a passenger, music tends to change the behaviour of younger drivers more than it does older groups. Again, sampled New South Wales drivers were the most likely to have their aggression be influenced by music, whereas Tasmanians were again the least likely.
3.7 Do you feel like certain makes/models of car make a driver more likely to be aggressive on the roads?
Results indicate that Australians carry biases on the roads, believing certain makes and models of car to be driven by more aggressive drivers. This could lead to premeditated, or prejudiced aggression on the roads.
3.8 Which of these signs in cars would make you less likely to be aggressive to the driver?*
State
None of the above, I would treat every motorist the same way | L Plates | Disability sticker | Baby on Board | P Plates | |
|---|---|---|---|---|---|
| NSW | 49.4% | 36.8% | 26.7% | 25.8% | 16.6% |
| Vic | 51.1% | 37.7% | 22.9% | 22.1% | 14.4% |
| Qld | 58.2% | 32.3% | 22.8% | 17.7% | 10.3% |
| WA | 48.1% | 36.7% | 25.3% | 26.6% | 19.0% |
| SA | 53.6% | 34.5% | 27.4% | 21.4% | 10.7% |
| Tas | 48.2% | 44.4% | 22.2% | 14.8% | 22.2% |
| Aus | 52.2% | 35.7% | 24.8% | 22.3% | 14.3% |
Age
None of the above, I would treat every motorist the same way | L Plates | Disability sticker | Baby on Board | P Plates | |
|---|---|---|---|---|---|
| 18-24 | 39.4% | 40.9% | 26.8% | 19.7% | 22.5% |
| 25-34 | 48.2% | 34.5% | 30.5% | 26.1% | 13.7% |
| 35-44 | 51.8% | 36.4% | 19.5% | 22.6% | 15.9% |
| 45-54 | 56.0% | 31.0% | 21.2% | 24.5% | 12.0% |
| 55-64 | 50.3% | 42.2% | 23.7% | 16.8% | 11.6% |
| 65+ | 62.3% | 32.5% | 27.8% | 21.2% | 15.2% |
| Total | 52.2% | 35.7% | 24.8% | 22.3% | 14.3% |
Gender
None of the above, I would treat every motorist the same way | L Plates | Disability sticker | Baby on Board | P Plates | |
|---|---|---|---|---|---|
| Female | 54.7% | 35.8% | 22.1% | 19.0% | 11.7% |
| Male | 49.2% | 35.5% | 28.0% | 26.3% | 17.4% |
| Total | 52.2% | 35.7% | 24.8% | 22.3% | 14.3% |
*Users were able to select multiple answers, meaning values may not add up to 100%.
Around 50% of drivers wouldn’t change their aggression toward other motorists, no matter if they had a special consideration sign on their car. L-plates were the most likely sign to change another driver’s behaviour, with around 36% of drivers indicating they would be less aggressive toward a learner.
Younger drivers (aged 18 to 24) tend to be more forgiving of learners, however have less sympathy for a driver with a baby on board.
3.9 Do you use any mindfulness, breathing, or calming strategies if you find yourself aggravated by other road users?
Only 30% of Australians surveyed have strategies in place to calm themselves if they get aggravated by other road users. This leaves around 70% most likely holding onto anger, and more susceptible to disturbances as their journey continues.
3.10 Do you think the police should do more to respond urgently to complaints of road rage?
State
Age
Gender
Most Australians feel the police need to do more to combat road rage. Particularly Australians aged over 65, where over 92% felt this way. Queenslanders (85%) and Tasmanians (89%) also had higher-than-average rates of wanting more police input on road rage issues.
4.0 Tips for avoiding road rage
Carpooling
Having calm people with you might persuade you to let go of anger on the road. If someone is more likely to keep you calm on the road, they’re worth having around.
Consider breathing and mindfulness exercises
Apps such as Calm or Headspace can help you learn tips and tricks for improving your state of mind, and reducing your anger on the roads.
Try not to make eye contact
To avoid setting other drivers off, you’re often best to avoid eye contact. Looking directly at them can make them feel threatened, and more likely to express anger toward you.
See More Research