
10 September 2025 | See disclaimer
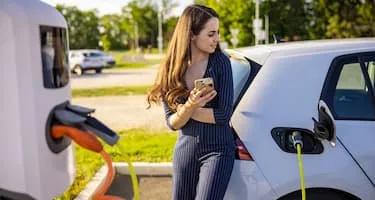
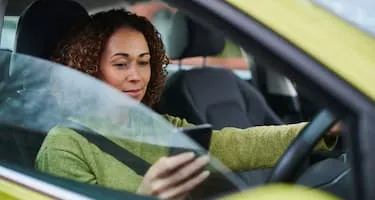
Using your mobile phone while driving is a major risk not only to you but also to your passengers and other drivers.
We surveyed 1000 Australians (aged 18+) on their attitudes and behaviours towards using a mobile while driving.
We also compared these results to Mobile Phones While Driving Survey and Statistics 2023 and Using a mobile phone while driving survey 2020 to understand trends from 2020 and 2023 when similar surveys were conducted.
Find out what Australians think about using mobile phones while driving and what they think would be the best way to discourage texting while driving.
Quick Stats
-
Nearly 80% of respondents said they do not feel confident using their phones while driving.
-
Only 30% of respondents said texting while driving was most likely to lead to a road fatality.
-
Close to 60% of Australian respondents said a fine of $1000 or more would most likely stop them from texting while driving.
Using Mobile Phones While Driving Statistics
In 2024, the Australian Automobile Association (AAA) published a comparative analysis on aspects of using a mobile phone while driving from three comprehensive technical academic reports from the Centre of Accident Research and Road Safety - Queensland (CARRS-Q). [1]
This analysis covers two Australian samples:
-
Drivers aged 17-25 years
-
Drivers aged 26 years or more
This research identifies that existing studies on distracted driving are focused on the ways that Australians have traditionally used their mobile phones, such as calling and texting.
Through research, we can broaden our understanding of how people use their mobile phones while driving.
Distracted Driving Behaviours in a Typical Week
Drivers 17-25 Years | Drivers 26+ years | |
|---|---|---|
Looked at screen of a smartphone held in hand while driving | 46.1% | 28.1% |
Looked at the screen of a smartphone kept in a phone holder/cradle while driving | 46.2% | 37.4% |
Used voice commands (e.g. Siri) to control phone while driving | 30.6% | 25.2% |
Used vehicle controls (e.g. steering wheel buttons and/or a head-up display) to control phone while driving | 42% | 38.3% |
This research found that in a typical week more than 46% of 17-25-year-old drivers looked at the screen of a smartphone held in their hands while driving (which is illegal in Australia). [1]
Specific Distracted Driving Behaviours
Drivers 17-25 Years | Drivers 26+ years | |||
|---|---|---|---|---|
In Moving Traffic | In Stop-Start Traffic or at Traffic Lights | In Moving Traffic | In Stop-Start Traffic or at Traffic Lights | |
Created a post on social media | 1.1% | 2.3% | 0.9% | 1.7% |
Scrolled through a social newsfeed | 2.3% | 4.6% | 2.3% | 6.1% |
Participated in a chat (one to one or group) | 10.3% | 24.1% | 5.5.% | 8.7% |
Participated in a chat via video (one to one or group) | 2.9% | 2.9% | 0.9% | 1.4% |
Watched videos | 1.1% | 4.0% | 1.7% | 2.6% |
Used a photo messaging app | 7.5% | 19.5% | 1.7% | 3.2% |
Nearly a quarter of drivers aged 17-25 used their phone to participate in a one-to-one or group chat in stop-start traffic or at traffic lights. [1]
Nearly 10% of this age group also used their phone to participate in a chat, while in moving traffic. [1]
And nearly 20% of 17-25-year-old drivers used a photo messaging app in stop-start traffic or at traffic lights. [1]
Using Phone Apps While Driving
Drivers 17-25 Years | Drivers 26+ years | |||
|---|---|---|---|---|
In Moving Traffic | In Stop-Start Traffic or at Traffic Lights | In Moving Traffic | In Stop-Start Traffic or at Traffic Lights | |
Texting-only apps | 12.1% | 31.2% | 7.5% | 14.2% |
Picture or content sharing social media | 4.6% | 12.1% | 2.6% | 4.6% |
Music apps | 64.7% | 75.1% | 23.1% | 25.1% |
Video streaming | 2.9% | 3.5% | 2.0% | 2.3% |
Driving apps | 33.5% | 38.2% | 17.9% | 20.8% |
Three-quarters of drivers 17-25 years of age used music apps in stop-start traffic or at traffic lights, while nearly 65% of this age group also used music apps in moving traffic. [1]
Using Mobile Phones While Driving Survey Results
Do you/would you feel confident driving while using your phone?
Australia
Age
State
Trends Over Time
Nearly 80% of respondents said they do not feel confident using their phones while driving.
In 2025, the percentage of respondents who said they feel confident using their phone while driving has increased from our last survey in 2023.
What’s the main way you’ve used your mobile phone while driving in the past two weeks?
Australia
Age
| 18-27 | 28-37 | 38-47 | 48-57 | 58-67 | 68-75 | |
|---|---|---|---|---|---|---|
| I’ve checked my phone while stopped at traffic lights | 7.0% | 11.2% | 11.1% | 5.1% | 3.6% | 5.7% |
| I’ve changed songs on a playlist | 17.8% | 10.7% | 4.8% | 0.6% | 1.8% | 0.0% |
| I’ve read and/or replied to a text message | 3.2% | 7.8% | 2.1% | 1.7% | 1.2% | 1.0% |
| I’ve checked and/or updated social media | 3.2% | 2.9% | 1.1% | 1.1% | 0.0% | 0.0% |
| I’ve used a navigation app (GPS) on my phone | 32.5% | 25.9% | 24.3% | 21.4% | 19.3% | 13.3% |
| I’ve taken photos and videos using my phone | 3.2% | 2.9% | 2.1% | 0.6% | 0.0% | 0.0% |
| I did not use my phone | 31.9% | 37.1% | 52.9% | 69.7% | 72.9% | 79.1% |
| Other | 1.3% | 1.5% | 1.6% | 0.0% | 1.2% | 1.0% |
State
| NSW | Vic | Qld | WA | SA | |
|---|---|---|---|---|---|
| I’ve checked my phone while stopped at traffic lights | 8.3% | 10.7% | 3.0% | 6.7% | 8.3% |
| I’ve changed songs on a playlist | 8.6% | 6.1% | 5.0% | 2.9% | 2.8% |
| I’ve read and/or replied to a text message | 2.6% | 3.5% | 3.5% | 2.9% | 5.6% |
| I’ve checked and/or updated social media | 1.6% | 1.9% | 0.5% | 2.9% | 0.0% |
| I’ve used a navigation app (GPS) on my phone | 22.6% | 24.1% | 28.4% | 28.9% | 15.3% |
| I’ve taken photos and videos using my phone | 1.0% | 1.2% | 3.0% | 1.9% | 1.4% |
| I did not use my phone | 54.5% | 51.0% | 55.7% | 52.9% | 66.7% |
| Other | 1.0% | 1.5% | 1.0% | 1.0% | 0.0% |
More than 55% of respondents did not use their phone while driving in the past two weeks. While nearly a quarter of respondents (23.4%) said they’ve used a navigation app (GPS) on their phone.
Almost 18% of respondents aged 18-27 said they’ve changed songs on a playlist while driving in the past two weeks.
What’s the main reason you’ve used your mobile phone while driving in the past two weeks?
Australia
Age
| 18-27 | 28-37 | 38-47 | 48-57 | 58-67 | 68-75 | |
|---|---|---|---|---|---|---|
| I felt safe and capable doing so | 42.1% | 43.4% | 44.9% | 37.0% | 48.9% | 54.6% |
| It’s a habit or something I always do | 24.3% | 19.4% | 15.7% | 13.0% | 6.7% | 4.6% |
| It was an emergency | 14.0% | 22.5% | 13.5% | 13.0% | 8.9% | 9.1% |
| I did not use my phone | 19.6% | 14.7% | 25.8% | 37.0% | 35.6% | 31.8% |
State
Of the respondents who said they used their phone in the last two weeks (in the previous question), 43.7% said the main reason they used their phone while driving is because they felt safe and capable of doing so.
Nearly a quarter of respondents said there was no main reason, and they did not use their phone.
In your opinion, which of these scenarios is the most acceptable, with the phone out of its cradle?
Australia
Age
| 18-27 | 28-37 | 38-47 | 48-57 | 58-67 | 68-75 | |
|---|---|---|---|---|---|---|
| Replying to a text while driving at 40km/h | 5.1% | 4.9% | 2.7% | 0.6% | 0.0% | 0.0% |
| Checking my phone while stopped at a traffic light | 15.3% | 17.1% | 12.7% | 7.9% | 6.6% | 5.7% |
| Changing a song on a playlist | 14.0% | 9.3% | 5.8% | 1.1% | 0.0% | 0.0% |
| Using a navigation app on my phone | 28.7% | 21.0% | 24.9% | 20.2% | 12.1% | 16.2% |
| None, no phone use is acceptable | 36.9% | 47.8% | 54.0% | 70.2% | 81.3% | 78.1% |
State
| NSW | Vic | Qld | WA | SA | |
|---|---|---|---|---|---|
| Replying to a text while driving at 40km/h | 3.2% | 3.5% | 0.5% | 1.9% | 1.4% |
| Checking my phone while stopped at a traffic light | 13.7% | 10.7% | 8.5% | 13.5% | 11.1% |
| Changing a song on a playlist | 8.0% | 5.0% | 4.0% | 2.9% | 2.8% |
| Using a navigation app on my phone | 18.5% | 21.8% | 23.9% | 19.2% | 20.8% |
| None, no phone use is acceptable | 56.7% | 59.0% | 63.2% | 62.5% | 63.9% |
Nearly two-thirds of Australian respondents said that no phone use (out of the cradle) is acceptable.
While more than 20% of respondents said using a navigation app on their phone is the most acceptable scenario when it’s out of the cradle.
Of the respondents aged 18-27, 14% said changing a song on a playlist and nearly 30% said using a navigation app on their phone are the most acceptable scenarios.
More than 80% of respondents aged 58-67 said that no phone use is acceptable.
In your opinion, which of these scenarios is the most acceptable, with the phone in its cradle?
Australia
Age
| 18-27 | 28-37 | 38-47 | 48-57 | 58-67 | 68-77 | |
|---|---|---|---|---|---|---|
| Replying to a text while driving at 40km/h | 4.5% | 2.9% | 1.6% | 1.1% | 0.0% | 0.0% |
| Checking my phone while stopped at a traffic light | 10.8% | 12.7% | 9.5% | 9.0% | 6.6% | 5.7% |
| Changing a song on a playlist | 12.1% | 7.3% | 4.2% | 2.8% | 1.2% | 1.0% |
| Using a navigation app on my phone | 36.9% | 38.1% | 35.5% | 35.4% | 33.7% | 36.2% |
| None, no phone use is acceptable | 35.7% | 39.0% | 49.2% | 51.7% | 58.4% | 57.1% |
State
| NSW | Vic | Qld | WA | SA | |
|---|---|---|---|---|---|
| Replying to a text while driving at 40km/h | 1.6% | 2.7% | 2.0% | 1.0% | 1.4% |
| Checking my phone while stopped at a traffic light | 9.2% | 13.0% | 5.0% | 7.7% | 9.7% |
| Changing a song on a playlist | 5.7% | 5.0% | 3.5% | 4.8% | 5.6% |
| Using a navigation app on my phone | 36.0% | 36.0% | 40.3% | 38.5% | 30.6% |
| None, no phone use is acceptable | 47.5% | 43.3% | 49.3% | 48.1% | 52.8% |
Nearly 48% of respondents said no phone use (in a cradle) is acceptable.
Meanwhile, 36% of respondents said using a navigation app on their phone is the most acceptable scenario when it’s in a cradle.
While 12% of 18-27 year olds (double the national average) said changing a song on a playlist was acceptable while the phone is in a cradle.
Only 36% of respondents aged 18-27 said that no phone use is acceptable.
In your opinion, which of these behaviours is most likely to result in a road fatality?
Australia
Age
| 18-27 | 28-37 | 38-47 | 48-57 | 58-67 | 68-75 | |
|---|---|---|---|---|---|---|
| Texting while driving | 21.0% | 25.9% | 26.5% | 28.1% | 43.4% | 39.1% |
| Drink driving | 47.8% | 42.0% | 39.2% | 40.5% | 31.9% | 34.3% |
| Not wearing a seatbelt | 5.1% | 5.4% | 3.2% | 4.5% | 4.8% | 7.6% |
| Driving while tired | 13.4% | 9.8% | 7.9% | 6.7% | 4.2% | 3.8% |
| Speeding | 12.7% | 17.1% | 23.3% | 20.2% | 15.7% | 15.2% |
State
| NSW | Vic | Qld | WA | SA | |
|---|---|---|---|---|---|
| Texting while driving | 25.5% | 34.1% | 32.3% | 30.8% | 33.3% |
| Drink driving | 36.9% | 39.1% | 44.8% | 40.4% | 38.9% |
| Not wearing a seatbelt | 3.5% | 6.1% | 4.5% | 5.8% | 4.2% |
| Driving while tired | 10.2% | 6.5% | 4.5% | 10.6% | 4.2% |
| Speeding | 23.9% | 14.2% | 13.9% | 12.5% | 19.4% |
Trends Over Time
Nearly 40% of respondents said drink driving is most likely to result in a road fatality. Meanwhile, nearly 30% of respondents said texting while driving was most likely to lead to a road fatality.
Nearly 48% of 18-27-year-olds said drink driving was most likely to lead to road fatality.
In 2020, 20.5% of respondents said that not wearing a seatbelt was most likely to lead to a road fatality. This decreased significantly to 4.3% in 2023 and 4.9% in 2025.
While only 9.6% of respondents (in 2020) said speeding was most likely to lead to a road fatality, this result increased to 16.3% in 2023 and 17.7% in 2025.
In your opinion, what would be the most effective way of discouraging people from texting while driving?
Australia
Age
18-27 | 28-37 | 38-47 | 48-57 | 58-67 | 68-75 | |
|---|---|---|---|---|---|---|
Tougher penalties | 28.7% | 29.8% | 39.4% | 37.1% | 39.2% | 37.1% |
Mobile-detection cameras | 26.1% | 26.3% | 20.7% | 20.8% | 19.9% | 25.7% |
Increased awareness of distracted driving | 19.1% | 20.0% | 16.5% | 17.4% | 17.5% | 15.2% |
More law enforcement | 14.0% | 13.7% | 11.2% | 11.8% | 7.2% | 12.4% |
Nothing would be effective | 12.1% | 10.2% | 12.2% | 12.9% | 16.3% | 9.5% |
State
NSW | Vic | Qld | WA | SA | |
|---|---|---|---|---|---|
Tougher penalties | 34.1% | 38.5% | 32.3% | 38.5% | 33.3% |
Mobile-detection cameras | 25.2% | 21.9% | 21.4% | 22.1% | 22.2% |
Increased awareness of distracted driving | 18.2% | 19.6% | 16.9% | 17.3% | 12.5% |
More law enforcement | 12.1% | 8.5% | 14.4% | 8.7% | 13.9% |
Nothing would be effective | 10.5% | 11.5% | 14.9% | 13.5% | 18.1% |
Trends Over Time
Of those surveyed, 35% of Australian respondents said tougher penalties would be the most effective way to discourage texting while driving.
While 23% of respondents thought mobile detection cameras would be the most effective method.
In 2025, only 12.3% of respondents said there would be no effective way of discouraging Australians from texting while driving. This number has decreased since our survey in 2020, when 20.5% of participants selected the same response.
Of the following, which option would be most likely to stop you from texting while driving?
Australia
Age
18-27 | 28-37 | 38-47 | 48-57 | 58-67 | 68-75 | |
|---|---|---|---|---|---|---|
Fine of $1,000 or more | 51.6% | 54.6% | 47.6% | 56.7% | 68.7% | 68.6% |
Demerit points | 16.6% | 17.6% | 22.2% | 24.2% | 10.2% | 15.2% |
Fine of less than $1000 | 15.3% | 11.2% | 16.4% | 10.1% | 9.0% | 5.7% |
Peer pressure from passengers | 11.5% | 10.7% | 7.4% | 5.6% | 10.8% | 9.5% |
Nothing would stop me | 5.1% | 5.9% | 6.4% | 3.4% | 1.2% | 1.0% |
State
NSW | Vic | Qld | WA | SA | |
|---|---|---|---|---|---|
Fine of $1,000 or more | 51.0% | 52.1% | 67.7% | 61.5% | 66.7% |
Demerit points | 23.6% | 16.5% | 12.4% | 20.2% | 18.1% |
Fine of less than $1000 | 14.3% | 14.6% | 7.0% | 7.7% | 5.6% |
Peer pressure from passengers | 7.6% | 10.0% | 9.5% | 9.6% | 8.3% |
Nothing would stop me | 3.5% | 6.9% | 3.5% | 1.0% | 1.4% |
Trends Over Time
Close to 60% of Australian respondents said a fine of $1000 or more would most likely stop them from texting while driving.
Almost a quarter of respondents aged 48-57 said getting demerit points would most likely deter them from texting while driving.
Nearly 70% of respondents from Queensland said a fine of $1000 or more would most likely stop them from texting while driving.
While almost a quarter of respondents from New South Wales said they were most likely to stop texting while driving if they received demerit points.
In 2025, the respondents who said a fine of $1000 or more would most likely stop them from texting has doubled since 2020.
While the number of respondents who said nothing would stop them from texting while driving has significantly decreased since our survey in 2020.
What do you currently do to comply with mobile phone usage laws whilst driving? (Select all that apply)
Australia
Age
18-27 | 28-37 | 38-47 | 48-57 | 58-67 | 68-75 | |
|---|---|---|---|---|---|---|
I use voice control (such as Apple Siri or Google Assistant) | 29.9% | 28.3% | 21.2% | 15.7% | 16.9% | 11.4% |
I use car infotainment systems (such as Apple CarPlay and Android Auto) | 36.9% | 37.6% | 24.9% | 24.7% | 23.5% | 14.3% |
I use hands-free calling | 35.7% | 40.0% | 34.9% | 38.2% | 36.8% | 21.9% |
I don’t use any of these | 28.0% | 29.3% | 43.9% | 42.7% | 49.4% | 66.7% |
State
NSW | Vic | Qld | WA | SA | |
|---|---|---|---|---|---|
I use voice control (such as Apple Siri or Google Assistant) | 26.1% | 19.9% | 20.9% | 21.2% | 13.9% |
I use car infotainment systems (such as Apple CarPlay and Android Auto) | 31.9% | 24.1% | 30.4% | 25.0% | 25.0% |
I use hands-free calling | 35.7% | 38.7% | 38.3% | 36.5% | 29.2% |
I don’t use any of these | 37.9% | 38.7% | 40.3% | 43.3% | 50.0% |
More than 40% of respondents said they don’t use voice control, car infotainment systems or hands-free calling while driving.
While nearly 36% of respondents said they use hands-free calling while driving.
Almost 30% of respondents aged 18-27 said they used voice control while driving. And nearly 40% of 28-37-year-olds said they use a car infotainment system.
In your opinion, should it be legal for customers to pay for food at a drive-thru using their mobile phone?
Australia
Age
State
Trends Over Time
Nearly 54% of respondents said it should be legal for customers to pay for food at a drive-thru using their mobile phone.
In 2025, the number of respondents who said paying at a drive-thru using their mobile phone should not be legal decreased.
Key Takeaways
Younger Australians were more likely to change songs on a playlist while driving
Almost 18% of respondents aged 18-27 said they’ve changed songs on a playlist while driving in the past two weeks.
While 12% of 18-27 year olds (double the national average) said changing a song on a playlist was acceptable while the phone is in its cradle.
Almost 30% of respondents aged 18-27 also said they used voice control on their phone while driving.
Two in five respondents said they felt safe using their mobile phone while driving
Close to 45% of respondents said they used their phone while driving in the last two weeks.
More than 20% of these respondents said they used a navigation app on their mobile phone. Nearly 44% (43.7%) of this group said the main reason they used their phone was that they felt safe and capable of doing so.
While more than 20% of respondents said using a navigation app on their phone is the most acceptable scenario when it’s out of the cradle.
According to the Australian Road Rules (Driver Distraction) Amendment 2021, all Australian drivers must not touch or operate a mobile phone while the vehicle is moving or is stationary but not parked. [2]
A third of Australians think tougher penalties would be the most effective way of discouraging texting while driving
Of those surveyed, 35% of Australian respondents said tougher penalties would be the most effective way to discourage texting while driving.
In the following question, close to 60% of Australian respondents said a fine of $1000 or more would most likely stop them from texting while driving.
The largest group of respondents were from Queensland, where you can already receive a $1209 fine for using a mobile phone illegally while driving. [3]
Want to use this data?
If you would like to use this data or if you would like to see the complete findings from this survey please contact media@autogeneral.com.au.
See More Research