
26 March 2026 | See disclaimer
What do Australians think of a classic family road trip? We surveyed 1001 Australians (aged 18+) on their attitudes towards road trips, how they prepare, how far they drive, and more.
Take a closer look at our results, as well as comparisons between previous years’ surveys, and discover how Australian families like to hit the open road.
Quick Stats
- Almost 92% of respondents have taken a road trip in Australia, up 3% from 2022.
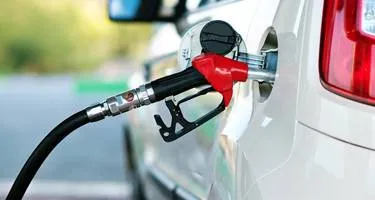
- One of the biggest barriers to taking road trips is the cost of fuel, with 36% of respondents answering that fuel prices are too high.
- The 35-49 age bracket is the most likely to travel with their immediate family, including their children (49%) and their partner (65%), but is one of the least likely groups to do pre-trip safety checks for their car.
- Pre-trip safety checks have quietly slipped over the past four years, with oil level checks down 6% and basic tyre pressure checks dropping 3%. This highlights a trend as more families plan for their next road trip getaway.
- Almost 40% of 18-27-year-olds made sure the vibes are high with music playlists on their pre-trip checklist.
What Are the Most Popular Road Trips for Australians
With a coastline measuring approximately 59,700 kilometres [1] and 18% of the country [2] comprising of red deserts, there is a wealth of awe-inspiring road trips that Australians love to follow. [3]
| Great Ocean Road | Great Barrier Reef Drive | Pacific Coast Way |
|---|---|---|
One of the most iconic and popular road trips, the Great Ocean Road follows the wild southern coastline, national parks, and stunning views of the Twelve Apostles. | Heading north from Cairns, the Great Barrier Reef Drive will take you through the tropics to the 150-million-year-old Daintree Rainforest, exploring the reef as you go. | Cruise by rainforests, busy cities, and hinterland towns with views of the Pacific Ocean as you make your way from Sydney to Brisbane. |
Looking for the ultimate road trip? Experience over 14,000 kilometres of open road by following the iconic National Highway 1, which will take you around the entire country and is popular with grey nomads and backpackers alike.
Or why not road trip with intent? Foodies in Melbourne can travel to the Mornington Peninsula - a gourmet region just an hour away from the city - to sip wine and fine dine, while Tasmanians should check out the Huon Valley for organic cheeses and free-flowing apple cider. If you’re going to spend the day sipping wine, make sure you’ve organised someone to be the designated driver for your road trip.
More of a nature-lover? Coalseam Conservation Park - about four and a half hours outside of Perth - serves up breathtaking wildflowers along with great wildlife watching opportunities. Camping is also allowed during the peak wildflower season.
There are plenty more road trip options out there - check out more Australian road trips for your family.
Road Trip Preparations Checklist
Before you head off on your next road trip across Australia, no matter how far you’re driving, you should:
Plan which route you’re going to take ahead of time:
- Check your route for closed roads.
- Be aware of informational road signs like state highway numbers and road condition signs.
- Plan where you’ll stop for fuel and breaks (especially on longer journeys).
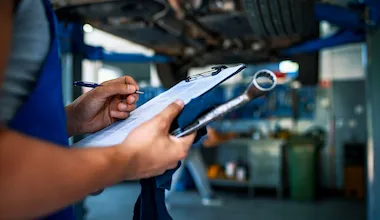
Prepare your car for the road trip:
- Clean your windscreen and ensure your washer fluid is filled.
- Check your fuel and engine oil levels.
- Check the spare wheel is in good condition with tread, and pumped to the correct inflation level.
- Pump all tyres on the car to their recommended inflation level.
- Test all lights/indicators on your vehicle before setting off.
- Check the lights/brakes on any trailer you may tow.
- Check the battery level if you have the equipment (such as a multimeter).
- Check when you last serviced your car and make any necessary bookings before travelling.
Pack a car emergency kit
- Pack enough food and water for the length of your trip.
- Torch and spare batteries.
- First Aid kit.
- Blankets.
- Jumper leads.
- Spare cash.
- Portable phone charger.
See our full list of what to pack in your car for an emergency.
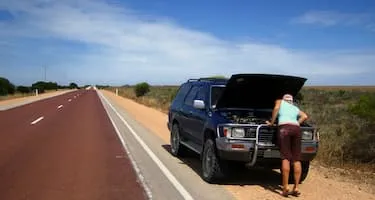
Before hitting the road, check that you have a roadside assistance membership. Just remember, roadside assistance will not cover breakdowns off-road or where access is restricted or in an inaccessible area*. This includes, but is not limited to, beaches, national parks, 4WD tracks and areas not accessible by a standard two-wheel drive recovery vehicle. Full details are available in the Roadside Assistance Terms and Conditions
It’s also worth checking that your car insurance policy is up to date. A few examples of things that you can do are check if you’re covered for the region you plan on travelling to, advise your insurer of any new modifications to your car and add all possible drivers on the trip to your policy. This could help avoid a denied claim in case an accident occurs on the road.
Family Road Trips Survey Results
How excited are you about the idea of going on a road trip?
Trends over time
| 2022 | 2024 | 2025 | |
|---|---|---|---|
| Not excited at all | 8.6% | 5.2% | 4.1% |
| Somewhat unexcited | 5.4% | 3.5% | 3.2% |
| Neutral | 30.1% | 11.5% | 13.8% |
| Somewhat excited | 24.7% | 45.3% | 46.8% |
| Extremely excited | 31.2% | 34.6% | 32.2% |
Australia
Age
State
Of those surveyed, almost 47% said they were somewhat excited about their upcoming road trip.
Residents of New South Wales are the most excited road-trippers, with 37% being extremely excited about the prospect of hitting the open road.
Have you taken a road trip before?
Trends over time
| 2022 | 2024 | 2025 | |
|---|---|---|---|
| Yes | 88.4% | 91.9% | 91.7% |
| No | 11.6% | 8.1% | 8.3% |
Australia
Age
State
A majority of Australians have travelled on a road trip. Nearly 92% responded that they have taken a road trip before.
The age group most likely to have taken a road trip are those aged between 35 and 49. Nearly 94% of respondents in this age group have road-tripped in the past.
Who did you go on your last road trip with?^
Trends over time
| 2022 | 2024 | 2025 | |
|---|---|---|---|
| My partner | 63.1% | 61.0% | 64.1% |
| My child/children | 26.2% | 28.5% | 29.1% |
| Friend/s | 18.1% | 21.2% | 16.3% |
| My parent/s | 10.1% | 10.3% | 7.2% |
| Other relative/s | 8.9% | 7.7% | 7.4% |
| Other | 0.9% | 0.7% | 1.1% |
| I went on a solo trip | 7.9% | 5.2% | 7.2% |
Australia
| My partner | 64.1% |
|---|---|
| My child/children | 29.1% |
| My parent/s | 7.2% |
| Other relative/s | 7.4% |
| Friend/s | 16.3% |
| Work or business colleague/s | 0.3% |
| I went on a solo trip | 7.2% |
| Other | 1.1% |
Age
| 18-34 | 35-49 | 50-64 | 65+ | |
|---|---|---|---|---|
| My partner | 56.4% | 64.9% | 60.3% | 74.2% |
| My child/children | 21.1% | 49.0% | 31.0% | 14.0% |
| My parent/s | 18.8% | 8.0% | 2.6% | 0.0% |
| Other relative/s | 12.4% | 7.1% | 3.9% | 6.6% |
| Friend/s | 21.1% | 18.4% | 15.1% | 10.9% |
| Work or business colleague/s | 0.9% | 0.0% | 0.0% | 0.4% |
| I went on a solo trip | 6.0% | 6.7% | 7.8% | 8.3% |
| Other | 1.4% | 0.0% | 2.6% | 0.4% |
^Respondents were able to select multiple answers, meaning numbers may exceed 100%
Partners by far took the most road trips together, with almost 65% of survey respondents stating that they travelled with their partner on their last road trip. This sentiment is echoed across all age groups.
Travelling with children on road trips was the second most popular choice (29%), followed by friends (16%).
Why have you not taken a road trip before?^
*Only participants who responded No to the previous question were presented with this question.
Australia
Age
State
| NSW | Vic | Qld | SA | WA | |
|---|---|---|---|---|---|
| Don’t like driving/traffic | 20.7% | 11.1% | 35.7% | 28.6% | 0.0% |
| Can’t take time off work | 34.5% | 7.4% | 7.1% | 14.3% | 25.0% |
| Too much time in the car | 24.1% | 18.5% | 28.6% | 57.1% | 25.0% |
| Fuel prices are too high | 27.6% | 48.2% | 28.6% | 57.1% | 25.0% |
| Doesn’t appeal to me | 31.0% | 18.5% | 21.4% | 14.3% | 50.0% |
| Prefer to travel by plane/public transport | 24.1% | 22.2% | 28.6% | 0.0% | 0.0% |
| Other | 6.9% | 22.2% | 14.3% | 0.0% | 25.0% |
^Respondents were able to select multiple answers, meaning numbers may exceed 100%
There are a few barriers to family road trips for some Australians, including the price of fuel. More than 36% of respondents noted that the price of fuel made road holidays too expensive, with 57% of those in South Australia also noting the price of fuel being an issue.
Queenslanders also dislike spending a lot of time in traffic, with close to 36% claiming that it is one of the main reasons they won’t take a road trip.
Those ages 18 to 34 have various other reasons not to take a road trip, but the appeal of driving the open road isn’t one of them. Zero respondents in this age bracket claimed that road trips don’t appeal to them, with other issues being more important factors.
A quarter of respondents simply do not like being confined to a car for an extended period.
How much of the driving did you do on your last road trip?
Trends over time
| 2022 | 2024 | 2025 | |
|---|---|---|---|
| All of it | 29.3% | 24.8% | 29.0% |
| Most of it | 16.4% | 22.6% | 26.1% |
| Half of it | 21.3% | 23.6% | 18.6% |
| A little bit | 15.3% | 13.9% | 13.9% |
| None | 17.6% | 15.1% | 12.3% |
Australia
State
| NSW | Vic | Qld | WA | SA | |
|---|---|---|---|---|---|
| All of it | 28.8% | 23.8% | 38.2% | 27.0% | 27.7% |
| Most of it | 24.7% | 28.3% | 21.0% | 31.8% | 27.7% |
| Half of it | 21.2% | 20.0% | 14.0% | 19.1% | 14.9% |
| A little bit of it | 13.0% | 14.6% | 14.5% | 14.3% | 15.8% |
| None | 12.3% | 13.3% | 12.4% | 7.9% | 13.9% |
*Due to how the figures are rounded within the data, numbers may not add up to exactly 100%
When it comes to how much driving road trip participants do, almost 30% of respondents said they do all of the driving on road trips, followed by 26% of respondents who said they do most of the driving.
Almost 40% of Queenslanders were committed to driving for the entire road trip.
Roughly speaking, how many hours of driving did your last road trip take?
Australia
State
*Due to how the figures are rounded within the data, numbers may not add up to exactly 100%
When it comes to how far Aussies are willing to drive during their road trips, almost 36% of road trippers drive between five to eight hours on average.
It turns out that Queenslanders are the most dedicated to longer road trips. More than 17% of survey respondents drove for more than 30 hours on their last road trip.
While 43% of South Australians prefer to keep their trips short and drove for less than five hours on their last road trip.
Did you use your own vehicle for your last road trip, or rent a vehicle?*
Australia
Vehicle Types
*Due to how the figures are rounded within the data, numbers may not add up to exactly 100%
Respondents were most likely to go on a road trip in their own vehicle. The majority (78%) of respondents used their own car, instead of renting a car or riding in another person’s vehicle.
What best describes the type of vehicle you took on your last road trip?*
Australia
Age
Close to half (47%) of those surveyed took their road trip in a sedan/hatchback/station wagon, followed by an SUV (33%).
Only around 1% of respondents said they drove a vehicle towing a caravan or a motorhome.
What preparations did you make before your last road trip?^
Trends over time
| 2022 | 2024 | 2025 | |
|---|---|---|---|
| Packed emergency water and food | 38.2% | 45.7% | 42.1% |
| Accurately checked tyre pressures and condition | 57.8% | 58.6% | 54.5% |
| Refilled washing fluid for the windscreen | 46.2% | 43.3% | 38.2% |
| Checked the oil | 56.7% | 56.3% | 50.3% |
| Checked the battery level | 33.9% | 35.1% | 29.2% |
| Planned the exact path for the journey | 56.4% | 57.3% | 57.7% |
| Checked the air and condition in the spare tyre | 43.6% | 45.8% | 41.9% |
| None of the above | 14.7% | 12.4% | 11.9% |
Australia
| Packed emergency water and food | 42.1% |
|---|---|
| Accurately checked tyre pressures and condition | 54.5% |
| Refilled washing fluid for the windscreen | 38.2% |
| Checked the oil | 50.3% |
| Checked the battery level | 29.2% |
| Planned the exact path for the journey | 57.7% |
| Checked the air and condition in the spare tyre | 41.9% |
| Created a music playlist | 26.3% |
| None of the above | 11.9% |
Age
| 18-34 | 35-49 | 50-64 | 65+ | |
|---|---|---|---|---|
| Packed emergency water and food | 39.5% | 46.9% | 42.2% | 39.3% |
| Accurately checked tyre pressures and condition | 34.4% | 55.2% | 59.9% | 67.3% |
| Refilled washing fluid for the windscreen | 22.0% | 32.6% | 43.5% | 54.2% |
| Checked the oil | 41.7% | 46.0% | 54.3% | 59.0% |
| Checked the battery level | 23.9% | 29.3% | 26.7% | 36.7% |
| Planned the exact path for the journey | 45.4% | 59.4% | 60.8% | 64.6% |
| Checked the air and condition in the spare tyre | 31.2% | 39.3% | 42.2% | 54.6% |
| Created a music playlist | 39.0% | 31.8% | 22.8% | 11.8% |
| None of the above | 12.8% | 10.0% | 12.9% | 11.8% |
Vehicle Type
| Sedan/hatchback/station wagon | 4x4 | SUV | 65+ | |
|---|---|---|---|---|
| Packed emergency water and food | 32.7% | 54.7% | 50.4% | 39.3% |
| Accurately checked tyre pressures and condition | 52% | 59% | 57.0% | 67.3% |
| Refilled washing fluid for the windscreen | 37.4% | 43.4% | 38.4% | 54.2% |
| Checked the oil | 51.0% | 56.5% | 47.5% | 59.0% |
| Checked the battery level | 24.5% | 34.7% | 32.5% | 36.7% |
| Planned the exact path for the journey | 58.3% | 60.0% | 60.9% | 64.6% |
| Checked the air and condition in the spare tyre | 39.8% | 49.5% | 41.6% | 54.6% |
| Created a music playlist | 24.8% | 24.3% | 29.6% | 11.8% |
| None of the above | 13.3% | 6.0% | 11.7% | 11.8% |
^Respondents were able to select multiple answers, meaning numbers may exceed 100%
According to our survey results, nearly 60% of respondents planned the exact path for the journey, along with checking tyre pressures and conditions (55%) and oil levels (50%).
Drivers over 65 were amongst the better prepared, with high numbers reported when it came to car care before a road trip.
Drivers behind the wheel of a 4x4 were also well-prepared, with high numbers reported for preparedness across the board.
It also seems that the younger generations love a good backing track for their road trip. Almost 40% of 18-27-year-olds make sure that creating a music playlist is on the pre-trip checklist.
Do you see yourself taking a road trip in the future?*
Australia
Age
*Due to how the figures are rounded within the data, numbers may not add up to exactly 100%
It’s safe to say that Australians love their road trips, with close to three-quarters (73.6%) saying they will take another road trip in the future.
However, the older generations are less likely, with 16% responding that they will not be taking another road trip in the future. Meanwhile, a majority of respondents (81%) aged 18 -34 are very keen to hit the road.
Key Takeaways
Young families are more likely to be under-prepared for road trips
The survey results show a 3% increase in Aussies taking road trips since 2022, but an overall downward trend in car safety checks.
This includes declines in windscreen fluid top-ups by 8%, oil level checks by 6% and basic tyre pressure checks by 3%.
Out of all age groups surveyed, the 35-49 age bracket was the most likely to have taken a road trip (96%), but just 33% of those surveyed said they neglected the simple safety check of refilling their windscreen fluid.
This age group was also one of the most likely to travel with their immediate family, including their children (49%) and their partner (65%).
Meanwhile, the older generations take pre-checks of their vehicles seriously, being the most vigilant when it comes to checking tyre pressure, battery level, oil levels and more.
The younger generations also love a good soundtrack to their road trip. Close to 40% rank making a playlist ahead of time as an essential part of their trip.
The price of fuel is one of the major barriers for those who want to take a road trip
The rising price of fuel is one of the top reasons that Australian families have put off a road trip, with 36% unable to afford a trip. Cost of living is very important to many Australians, particularly those of retirement age.
Being unable to take time off work is another contributing factor - 19% are unable to balance work and holidays.
Terms and conditions
- Please see our Roadside Assistance terms and conditions.