
27 August 2025 | See disclaimer
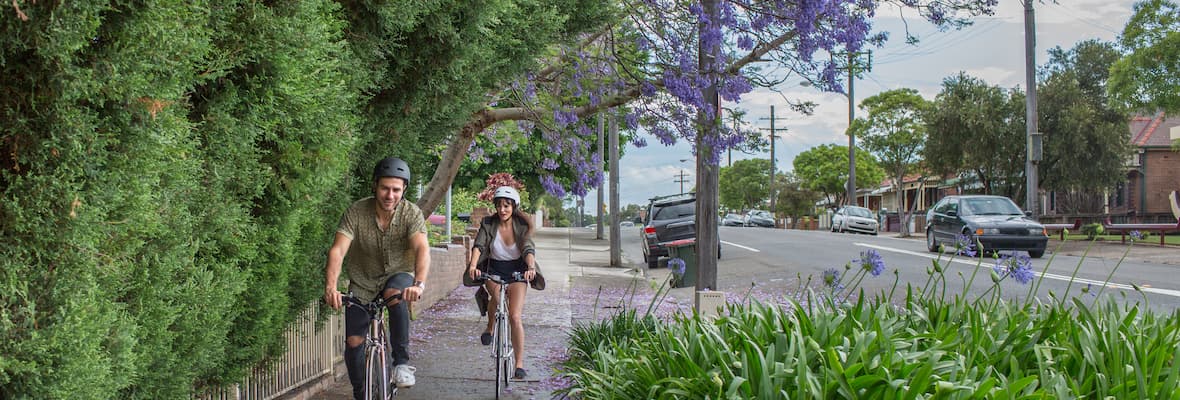
From drivers to passengers, pedestrians, motorcyclists and cyclists, many Australians are travelling on our roads every day.
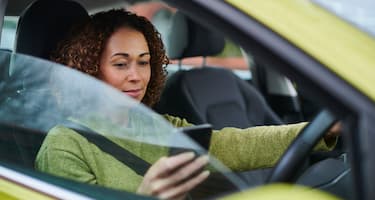
Registered passenger vehicles remained the largest group on Australian roads. As of 31 January 2024, there were 15.7 million registered passenger vehicles, which was a 2.4% increase on the previous year. [1]
To understand more about how every day road users feel, we surveyed 992 Australians (aged 18+) on their opinions about road safety and what they think are the safest and the most dangerous modes of transport.
Quick Stats
Close to 50% of respondents are on Australian roads every day. While 36% of respondents said they are on the road at least three times a week.
More than 37% of respondents thought that Australian roads have become somewhat more dangerous in the past 12 months.
More than 23% of respondents said motorbikes/mopeds were the most dangerous way to travel on Australian roads.
Australian Road Safety Statistics
According to the Australian Governments’ latest report on monthly road deaths, there were 1284 road deaths during the 12 months ending in March 2025^. [2]
This report covers road deaths, road deaths in the past 12 months, deaths per 100,000 people in the past 12 months and vulnerable road user deaths in the past 12 months.
Data on road users, age group, remoteness area and speed limit were sourced from this report to provide more context on the demographics and circumstances surrounding road deaths.
| Driver | Passenger | Pedestrian | Motorcyclist | Pedal Cyclist | |
|---|---|---|---|---|---|
| 2021 | 547 |
180 |
126 |
217 |
38 |
| 2022 | 542 |
184 |
134 |
229 |
40 |
| 2023 | 549 |
191 |
157 |
246 |
40 |
| 2024 | 578 |
210 |
176 |
258 |
31 |
| 2025 | 585 |
199 |
167 |
272 |
44 |
In the last 12 months (ending in March 2025), 45.6% of road deaths were drivers, 21.2% were motorcyclists and 15.5% were cyclists. [2]
| 0 to 7 | 8 to 16 | 17 to 25 | 26 to 39 | 40 to 64 | 65 to 74 | >75 | |
|---|---|---|---|---|---|---|---|
2021 |
21 |
39 |
205 |
293 |
343 |
86 |
120 |
2022 |
18 |
43 |
223 |
236 |
355 |
115 |
143 |
2023 |
17 |
49 |
225 |
264 |
365 |
118 |
151 |
2024 |
16 |
48 |
242 |
291 |
392 |
134 |
145 |
2025 |
16 |
40 |
218 |
272 |
396 |
151 |
184 |
The highest number of road deaths was in the 40 to 64-year-old age group.
| Major Cities of Australia | Inner Regional Australia | Outer Regional Australia | Remote Australia | Very Remote Australia | Unknown | |
|---|---|---|---|---|---|---|
2021 |
388 |
363 |
235 |
50 |
62 |
14 |
2022 |
370 |
374 |
262 |
65 |
54 |
12 |
2023 |
442 |
369 |
259 |
52 |
58 |
10 |
2024 |
413 |
439 |
256 |
62 |
48 |
51 |
2025 |
364 |
345 |
254 |
40 |
30 |
251 |
In the year ending in March 2025, the highest number of road deaths occurred in major cities in Australia. This was followed by road deaths in Inner Regional Australia and Outer Regional Australia.
| <40 km/h | 50 km/h | 60 to 75 km/h | 80 to 90 km/h | 100 km/h | >110 km/h | |
|---|---|---|---|---|---|---|
2021 |
14 |
116 |
236 |
191 |
338 |
115 |
2022 |
20 |
129 |
253 |
156 |
345 |
142 |
2023 |
27 |
115 |
305 |
186 |
322 |
148 |
2024 |
32 |
159 |
280 |
206 |
344 |
132 |
2025 |
28 |
129 |
296 |
192 |
337 |
129 |
^This data on monthly road deaths was current as of April 30th 2025.
While the largest number of road deaths occurred in the 100km/h speed limit, it was the number of road deaths in the <40km/h speed limit that increased by 20.4% on average per year. [2]
Australian Road Safety Survey Results
What is your main mode of transport?
| 18-27 | 28-37 | 38-47 | 48-57 | 58-67 | 68-77 | 78-87 | |
|---|---|---|---|---|---|---|---|
| Car (as the driver) | 65.2% |
64.5% |
72.7% |
72.4% |
74.0% |
82.9% |
75.5% |
| Car (as the passenger) | 10.8% |
5.4% |
4.1% |
6.8% |
8.2% |
5.4% |
13.2% |
| Walk | 5.1% |
5.9% |
9.3% |
3.7% |
6.9% |
2.7% |
7.6% |
| Train | 9.5% |
11.8% |
4.1% |
4.3% |
1.4% |
1.8% |
0.0% |
| Bus | 7.0% |
5.9% |
5.8% |
8.0% |
6.2% |
3.6% |
1.9% |
| Bicycle | 1.9% |
1.6% |
1.2% |
1.8% |
0.0% |
0.9% |
0.0% |
| Truck | 0.0% |
0.0% |
0.0% |
0.0% |
0.0% |
0.0% |
0.0% |
| Motorbike/moped | 0.0% |
0.5% |
0.0% |
0.0% |
0.0% |
0.9% |
0.0% |
| Tram/light rail | 0.6% |
2.7% |
0.0% |
2.5% |
1.4% |
0.0% |
0.0% |
| Taxi/rideshare service | 0.0% |
0.5% |
1.7% |
0.6% |
0.7% |
0.0% |
1.9% |
| Ferry | 0.0% |
1.1% |
0.0% |
0.0% |
0.7% |
0.0% |
0.0% |
| E-scooter/e-bike | 0.0% |
0.0% |
0.6% |
0.0% |
0.0% |
0.9% |
0.0% |
| Other | 0.0% |
0.0% |
0.6% |
0.0% |
0.7% |
0.9% |
0.0% |
| NSW | Vic | Qld | WA | SA | |
|---|---|---|---|---|---|
| Car (as the driver) | 66.5% |
73.6% |
74.8% |
75.0% |
70.4% |
| Car (as the passenger) | 5.6% |
6.2% |
9.9% |
9.6% |
5.6% |
| Walk | 7.2% |
6.2% |
4.5% |
2.9% |
5.6% |
| Train | 9.1% |
5.8% |
3.0% |
2.9% |
2.8% |
| Bus | 7.2% |
3.1% |
6.4% |
5.8% |
7.0% |
| Bicycle | 1.6% |
0.8% |
1.0% |
1.0% |
2.8% |
| Truck | 0.0% |
0.0% |
0.0% |
0.0% |
0.0% |
| Motorbike/moped | 0.3% |
0.0% |
0.0% |
0.0% |
1.4% |
| Tram/light rail | 0.3% |
3.1% |
0.5% |
0.0% |
2.8% |
| Taxi/rideshare service | 0.9% |
0.4% |
0.0% |
1.0% |
1.4% |
| Ferry | 0.9% |
0.0% |
0.0% |
0.0% |
0.0% |
| E-scooter/e-bike | 0.3% |
0.0% |
0.0% |
1.0% |
0.0% |
| Other | 0.0% |
0.8% |
0.0% |
1.0% |
0.0% |
More than 70% of respondents said their main mode of transport was their car (as a driver).
More than 7% of respondents said the car (as a passenger) was their main mode of transport, followed by 6% who took the bus, 5.9% who walked and 5.5% who took the train.
Female respondents were more likely to travel in the car as a passenger than male respondents.
Nearly 10% of respondents from New South Wales took the train as their main mode of transport.
Over 3% of Victorians took the tram as their main mode of transport, followed by South Australia at just under 3%.
How often are you on Australian roads?
Close to 50% of respondents are on Australian roads every day. While 36% of respondents said they are on the road at least three times a week.
Compared to results from 2023, the number of respondents who are on Australian roads every day has decreased in 2025.
In your opinion, have Australian roads become safer or more dangerous over the last 12 months?
Nearly 40% of respondents said there wasn’t any change to Australian roads over the last 12 months.
Around 38% of respondents thought that Australian roads have become somewhat more dangerous in the past 12 months.
More than 42% of male respondents said there wasn’t any change to Australian roads.
Has your opinion on Australian road safety affected your decision about which type of transportation you choose?
Female |
Male |
|
|---|---|---|
Yes, I've changed my main mode of transportation |
3.4% |
2.6% |
Yes, I've improved my main mode of transportation |
7.4% |
10.6% |
Yes, I've minimised my time on Australian roads |
14.6% |
15.5% |
Yes, I've increased my time on Australian roads |
3.4% |
1.6% |
Not sure |
8.4% |
7.1% |
| No, nothing has changed | 62.8% |
62.6% |
18-27 |
28-37 |
38-47 |
48-57 |
58-67 |
68-77 |
78-87 |
|
|---|---|---|---|---|---|---|---|
Yes, I've changed my main mode of transportation |
6.3% |
4.8% |
1.7% |
1.2% |
1.4% |
1.8% |
3.8% |
Yes, I've improved my main mode of transportation |
13.9% |
11.8% |
13.4% |
8.0% |
1.4% |
4.5% |
3.8% |
Yes, I've minimised my time on Australian roads |
14.6% |
19.9% |
15.1% |
15.3% |
13.0% |
9.9% |
15.1% |
Yes, I've increased my time on Australian roads |
5.1% |
3.8% |
4.1% |
0.6% |
0.7% |
0.9% |
0.0% |
Not sure |
7.6% |
8.6% |
9.9% |
9.2% |
8.2% |
4.5% |
0.0% |
| No, nothing has changed | 52.5% |
51.1% |
55.8% |
65.6% |
75.3% |
78.4% |
77.4% |
NSW |
Vic |
Qld |
WA |
SA |
|
|---|---|---|---|---|---|
Yes, I've changed my main mode of transportation |
2.8% |
2.7% |
2.5% |
6.7% |
2.8% |
Yes, I've improved my main mode of transportation |
11.9% |
9.3% |
5.9% |
5.8% |
5.6% |
Yes, I've minimised my time on Australian roads |
13.5% |
19.0% |
14.4% |
10.6% |
22.5% |
Yes, I've increased my time on Australian roads |
3.5% |
3.1% |
0.5% |
3.9% |
0.0% |
Not sure |
6.3% |
7.0% |
8.9% |
10.6% |
4.2% |
No, nothing has changed |
62.1% |
58.9% |
67.8% |
62.5% |
64.8% |
2023 |
2025 |
|
|---|---|---|
Yes, I've changed my main mode of transportation |
3.4% |
3.0% |
Yes, I've improved my main mode of transportation |
9.3% |
9.0% |
Yes, I've minimised my time on Australian roads |
18.5% |
15.0% |
Yes, I've increased my time on Australian roads |
2.9% |
2.5% |
Not sure |
3.2% |
7.8% |
No, nothing has changed |
62.7% |
62.7% |
Nearly two-thirds of respondents (62.7%) said their opinion on Australian road safety hasn’t affected which type of transport they use.
There were 15% of respondents who said they’ve minimised their time on Australian roads as a result of their opinion on road safety.
In 2025, the percentage of respondents who said they minimised their time on Australian roads has decreased since our last road safety survey in 2023.
Which mode of transport is the safest on Australian roads?
| 18-27 | 28-37 | 38-47 | 48-57 | 58-67 | 68-77 | 78-87 | |
|---|---|---|---|---|---|---|---|
| Car (as the driver) | 42.4% |
42.5% |
45.9% |
39.3% |
36.3% |
40.5% |
32.1% |
| Car (as the passenger) | 12.0% |
4.3% |
2.9% |
3.1% |
6.2% |
2.7% |
3.8% |
| Walk | 8.2% |
10.8% |
10.5% |
11.0% |
11.0% |
8.1% |
11.3% |
| Train | 22.2% |
29.0% |
26.2% |
27.6% |
23.3% |
29.7% |
37.7% |
| Bus | 4.4% |
5.9% |
7.0% |
9.2% |
9.6% |
6.3% |
11.3% |
| Bicycle | 0.0% |
1.1% |
0.6% |
0.0% |
0.0% |
0.0% |
0.0% |
| Truck | 0.6% |
1.1% |
0.0% |
0.6% |
0.7% |
2.7% |
1.9% |
| Motorbike/moped | 0.0% |
0.0% |
0.0% |
0.0% |
0.0% |
0.0% |
0.0% |
| Tram/light rail | 6.3% |
3.2% |
2.9% |
5.5% |
8.2% |
3.6% |
1.9% |
| Taxi/rideshare service | 0.6% |
0.0% |
1.2% |
0.6% |
0.0% |
0.9% |
0.0% |
| Ferry | 0.0% |
0.5% |
1.2% |
0.0% |
2.1% |
1.8% |
0.0% |
| E-scooter/e-bike | 0.6% |
0.0% |
0.0% |
0.0% |
0.0% |
0.0% |
0.0% |
| Other | 2.5% |
1.6% |
1.7% |
3.1% |
2.7% |
3.6% |
0.0% |
More than 40% of respondents said driving a car was the safest mode of transport.
More than a quarter of participants said taking the train was the safest mode of transport.
While 10% of respondents said walking was the safest way to travel.
In Victoria, more than 32% of respondents said the train was the safest way of travelling.
Which mode of transportation do you feel is the most dangerous on Australian roads?
| 18-27 | 28-37 | 38-47 | 48-57 | 58-67 | 68-77 | 78-87 | |
|---|---|---|---|---|---|---|---|
| Car (as the driver) | 20.9% |
21.0% |
17.4% |
17.2% |
19.2% |
9.0% |
3.8% |
| Car (as the passenger) | 8.9% |
7.0% |
8.1% |
7.4% |
6.2% |
3.6% |
5.7% |
| Walk | 6.3% |
7.5% |
5.2% |
3.7% |
0.7% |
0.9% |
0.0% |
| Train | 2.5% |
4.3% |
0.6% |
1.2% |
0.7% |
0.0% |
0.0% |
| Bus | 1.9% |
1.6% |
1.7% |
0.0% |
0.7% |
0.0% |
0.0% |
| Bicycle | 17.1% |
23.1% |
27.9% |
22.7% |
19.9% |
21.6% |
28.3% |
| Truck | 6.3% |
2.7% |
2.3% |
6.8% |
6.2% |
6.3% |
5.7% |
| Motorbike/moped | 24.1% |
19.4% |
20.9% |
25.2% |
26.7% |
27.9% |
17.0% |
| Tram/light rail | 0.0% |
0.0% |
0.6% |
0.0% |
0.0% |
0.0% |
0.0% |
| Taxi/rideshare service | 1.3% |
1.1% |
1.2% |
0.0% |
0.7% |
0.0% |
0.0% |
| Ferry | 0.6% |
0.5% |
0.6% |
0.6% |
0.0% |
0.9% |
0.0% |
| E-scooter/e-bike | 10.1% |
11.8% |
13.4% |
15.3% |
19.2% |
29.7% |
39.6% |
More than 23% of respondents said motorbikes/mopeds were the most dangerous ways to travel on Australian roads. This was very closely followed by 22.5% of respondents who said bicycles were the most dangerous mode of transport.
The same number of respondents (17%) said that driving a car and riding an e-scooter/e-bike were the most dangerous modes of transport on Australian roads.
Nearly 30% of 38-47-year-olds said that bicycles were the most dangerous way to travel on Australian roads.
More than 28% of respondents from Queensland said that e-scooters/e-bikes were the most dangerous mode of transport.
Key Takeaways
Australians are changing how often they travel on the road
In 2023, 54.4% of respondents said they were on the road every day, while 31.3% travelled on Australian roads at least three times a week.
Meanwhile, in 2025, 48.4% of respondents said they travelled every day, and 35.9% said they were on the road at least three times a week.
This means that fewer respondents travel on the road every day while more respondents are on the road at least three times a week.
One-tenth of respondents said walking was the safest way to travel
While only 5.9% of respondents said walking was their main mode of transportation, 10% of all respondents said they thought walking was the safest way to travel.
Despite this misconception, pedestrians (also known as non-motorists) are classified as vulnerable road users (VRU) alongside motorcyclists and cyclists. [3]
Australians think driving a car is just as dangerous as riding an e-scooter and e-bike
The same percentage of respondents (17%) said that driving a car and riding an e-scooter/e-bike were the most dangerous modes of transport.
And the amount of respondents who thought an e-scooter/e-bike was the most dangerous mode of transport, increased with age.
Queenslanders were the most concerned about e-scooters/e-bikes with more than 28% of respondents saying they were the most dangerous mode of transport.