
The impact of burglary is devastating. Not only do victims lose valuable items, but they can also lose the feeling of safety in their own homes. Unfortunately, Australia has the 7th highest rate of burglaries in the world per 100,000 people and in 2021, almost 240,000 households experienced a break-in.
We have analysed local government, national crime, and police data for 20 cities to reveal the most prevalent months for recorded home burglaries.
When it comes to monthly peaks across all cities, February saw the most burglary crimes in 2020. The month saw an average of 271 recorded home break-ins across the locations analysed. The second and third months for the highest average burglaries were March and January with 260 and 242 crimes recorded respectively.
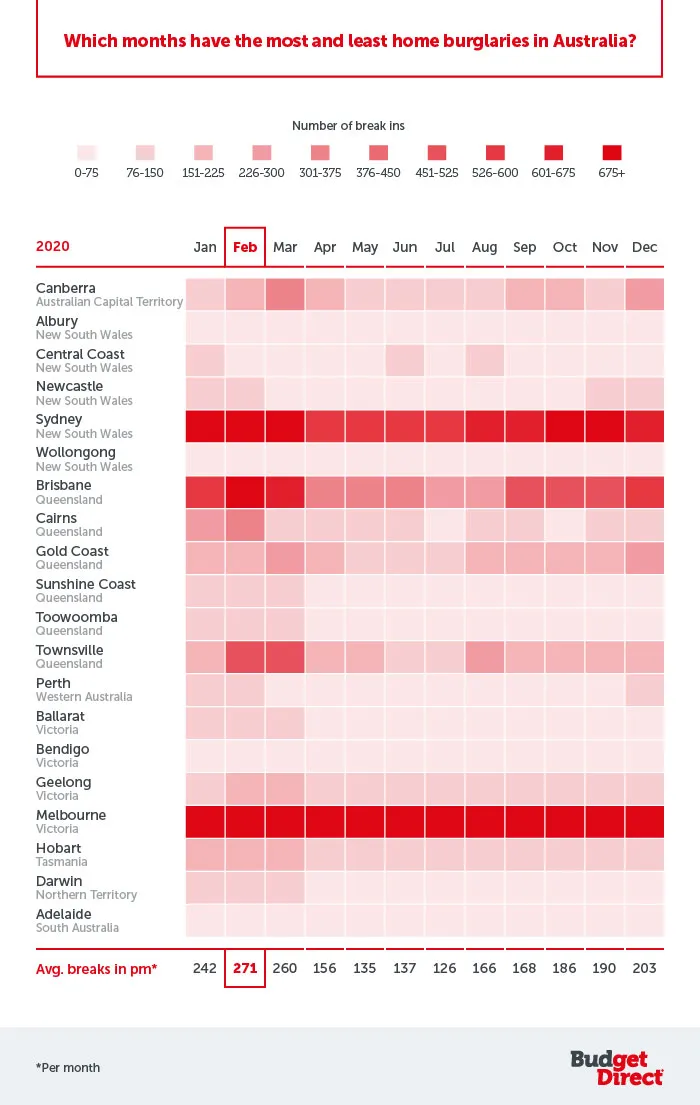
The month with the lowest average recorded home burglaries in 2020 was July, with the 20 cities analysed seeing an average of 126 crimes that month, 54% lower than the highest month February. The second-lowest month was May, with 135 burglaries on average.
Overall, for the majority of cities analysed, the most common months for increased burglaries were in summer or early Autumn. In fact, 19 out of the 20 cities we looked at saw their peak burglary figures in either January, February, or March.
When combined by state, cities in Victoria, including Ballarat, Bendigo, Geelong, and Melbourne, saw the highest amount of burglaries in 2020 with over 14,800. With a state population of over 6.6 million, the rate of home break-ins reported per 10,000 people equates to 22. Victoria’s safest month on average was July with almost 840 recorded burglaries, compared to its worst month February which saw over 1,790 burglaries. The state in the second spot for highest city burglaries is Queensland which saw just over 13,700 crimes in 2020, with its worst and safest months also being February and July respectively. Queensland has an estimated population of 5,206,400 which equates to 26 home break-ins reported per 10,000 people.
On the other end of the spectrum, when combined by state cities in South Australia and the Northern Territory saw the least burglaries overall, but both had clear dips and peaks across the year. For South Australia, it was the month of March that was the least safe for residents with burglaries 55% higher than in its safest month of June. Similarly, The Northern Territory saw a rise in crime in January, which dipped by 83% in its lowest crime months of June and August.
With Victoria topping the list of home break-ins for cities by state, it’s no surprise that its most populated city, Melbourne comes top for total break-ins by city overall in 2020. The city saw almost 12,400 break-ins over the year, which equates to 48 per 10,000 people. Its safest month was July which saw almost 700 break-ins, almost 800 fewer than the worst month of February when just under 1,500 burglaries were reported.
The safest city overall for residents was Adelaide, where over 330 break-ins were recorded during 2020. This works out as only 3 home break-ins were reported per 10,000 people. Unlike any other analysed city, Adelaide saw a peak in burglary crime during October, however, its worst month overall was March which saw 40 break-ins compared to its safest month of June which saw just under 20.
Methodology
Aira analysed reported home break-in crime data from Australia’s 20 biggest cities by population, across all the states, as well as the Australian Capital Territory and Northern Territory. Data covers the period from January to December 2020.
Different states record burglary/break-in/theft from different dwellings. Some states (SA, VIC, NT, ACT) record break-ins, and bundle theft from dwelling into “other theft”. To make the data comparable, Aria focused on the number of house break-ins (regardless of whether or not they resulted in theft) as a consistent metric to compare cities across states with varying approaches to recording burglaries.
For cities, where monthly crime data wasn’t available (i.e. cities in Victoria and Tasmania, where only annual crime figures are available), Aria estimated the number of monthly house break-ins as follows: annual data was gathered from 2015 to 2020, Aira then calculated the percentage of house break-ins that happened across each month of 2020 in other Australian cities in the dataset and then applied that % to the annual total number of house break-ins in each of Victoria’s and Tasmania’s cities.
For cities that form Australia’s metropolitan areas or are officially known as Greater Capital City Statistical Areas, i.e. Sydney, Melbourne, Brisbane, Adelaide, Perth, Hobart, and Darwin, both the population data and the crime data cover their metropolitan area, rather than just cities proper.
See More Home Security Guides