During 2021, there were over 20 million registered motor vehicles on Australia’s roads, and between 2020 and 2021 the national fleet increased by 1.7%. According to our research 2021 saw more than 190,000 motor vehicle thefts and thefts from motor vehicles across Australia.
We have analysed local government and national crime and police data[1] to reveal the most crime prevalent areas across the country for both motor thefts and thefts from motor vehicles. Take a look at our findings in the graphics below to see which states and cities top the list.
It is important to note that Brisbane and the Gold Coast recorded highest numbers of motor vehicle thefts in 2021, which could be attributed to Brisbane and the Gold Coast’s LGAs being a much bigger area than other cities such as Sydney.
Which Australian states have the most motor vehicle thefts?
There were a total of 55,427 vehicle thefts across the country during 2021, but when it comes to states that suffered the most from motor vehicle crime, it’s Queensland that takes the top spot. With over 15,805 thefts in 2021, the state sees a motor theft crime rate of 3.7 per 1,000 vehicles.
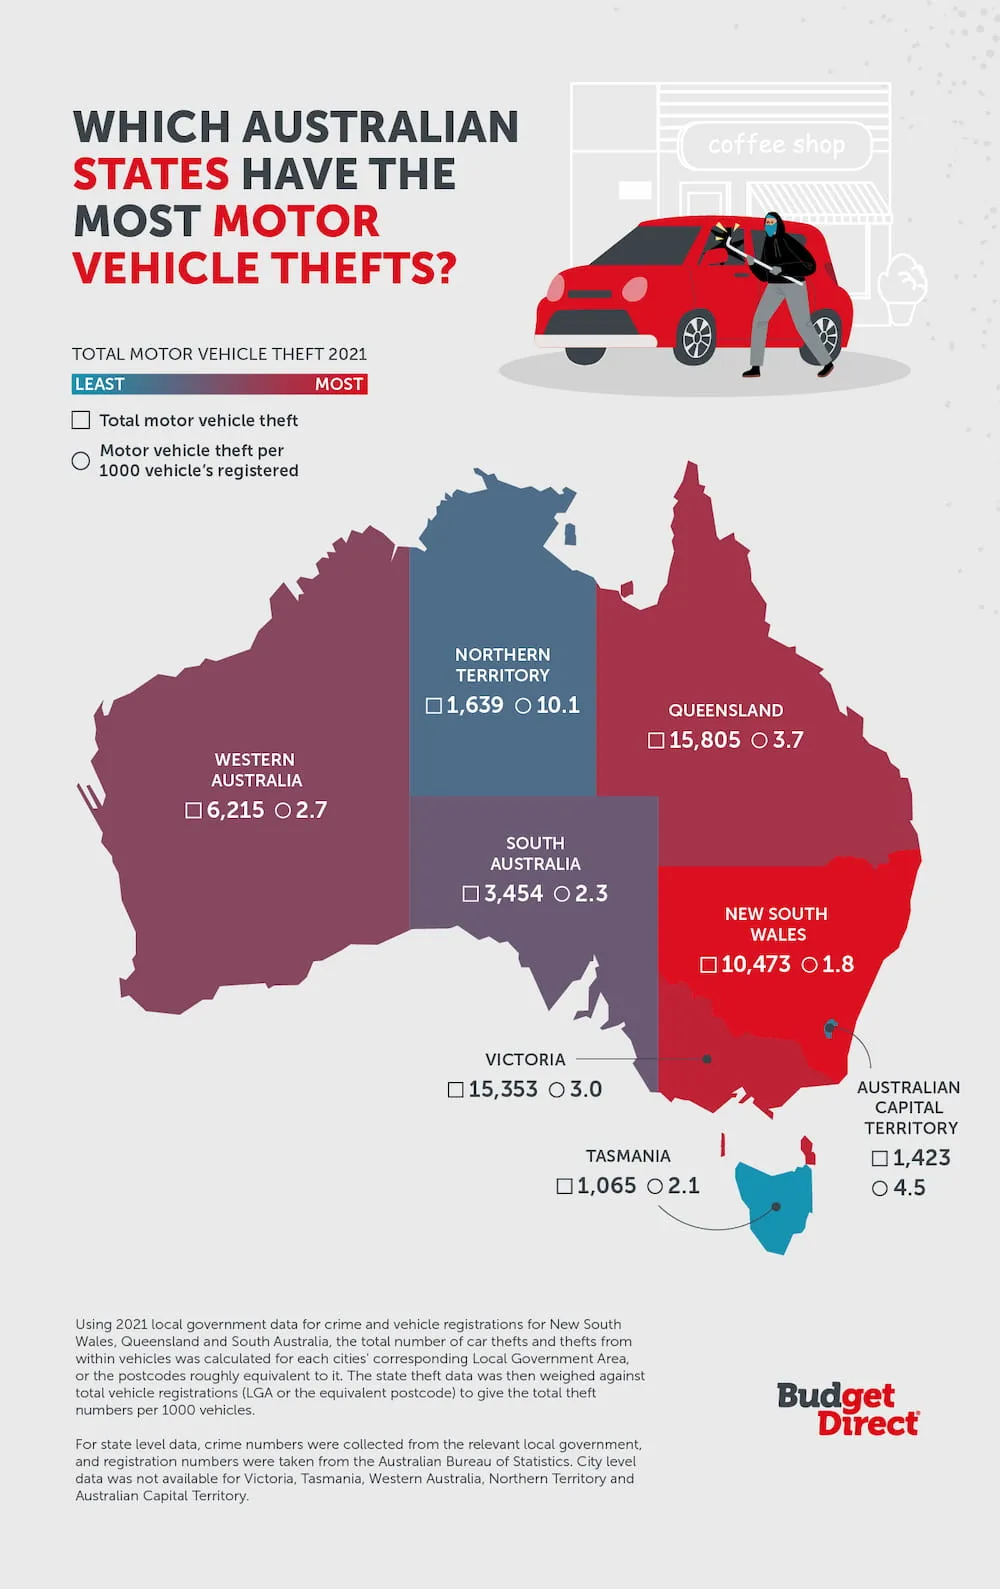
The Australian Capital Territory saw the lowest total number of motor thefts during 2021, with just under 1,500. However, when it comes to figures by 1,000 vehicles, the Australia Capital Territory ranks second for motor vehicle thefts, with 4.5 per 1,000. New South Wales sees the lowest figures for average theft rate per 1,000 vehicles with 1.8, followed by Tasmania with 2.1 and South Australia with 2.3.
Which Australian cities have the most motor vehicle thefts?
With the state of Queensland coming top for total motor vehicle thefts, it’s no surprise that when looking on a city level, all cities in Queensland rank highly. Brisbane tops the list with more than 3,500 motor vehicle thefts in 2021 - more than 1,000 thefts compared to second placed Gold Coast.
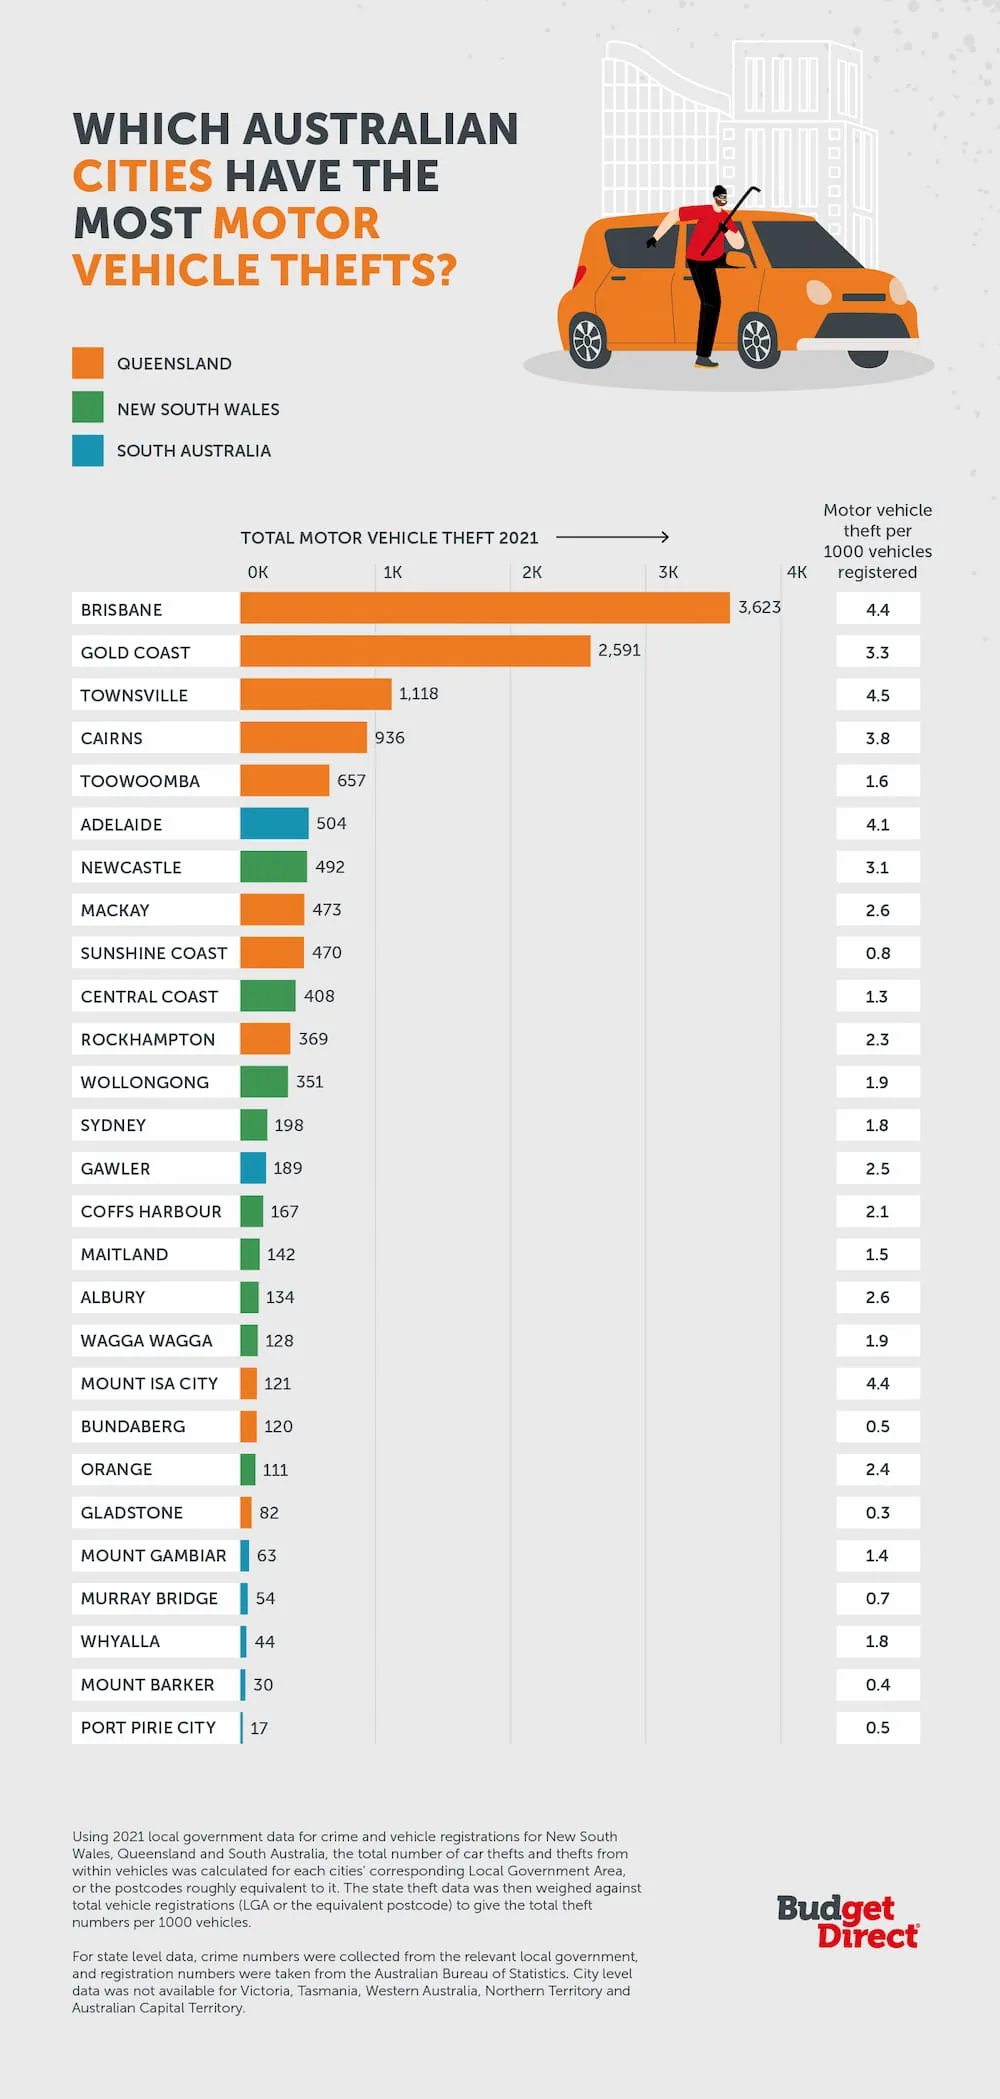
We’ve analysed cities motor vehicle thefts and discovered that Mackay and Rockhampton, both in Queensland, recorded 473 and 369 motor vehicle thefts respectively in 2021, the highest of the new additions.
Of all the cities analysed, Port Pirie City and Districts, South Australia, saw the fewest motor vehicle thefts, with only 17 reported crimes in 2021 - this equates to just 0.5 thefts per registered vehicle in this location. The city is closely followed by Mount Barker, also in South Australia, with 31 motor vehicle thefts and Murray Bridge with 54.
Which Australian cities have the most thefts from motor vehicles
Over the course of 2021, there were over 134,918 reported instances of theft from motor vehicles across the country. As the leading city for motor vehicle theft, it’s probably no surprise that Brisbane also tops the crime list for thefts from a motor vehicle, with over 7,400 crimes reported. Similarly, Port Pirie City and Districts, South Australia was the city with the lowest number of reported thefts (35).
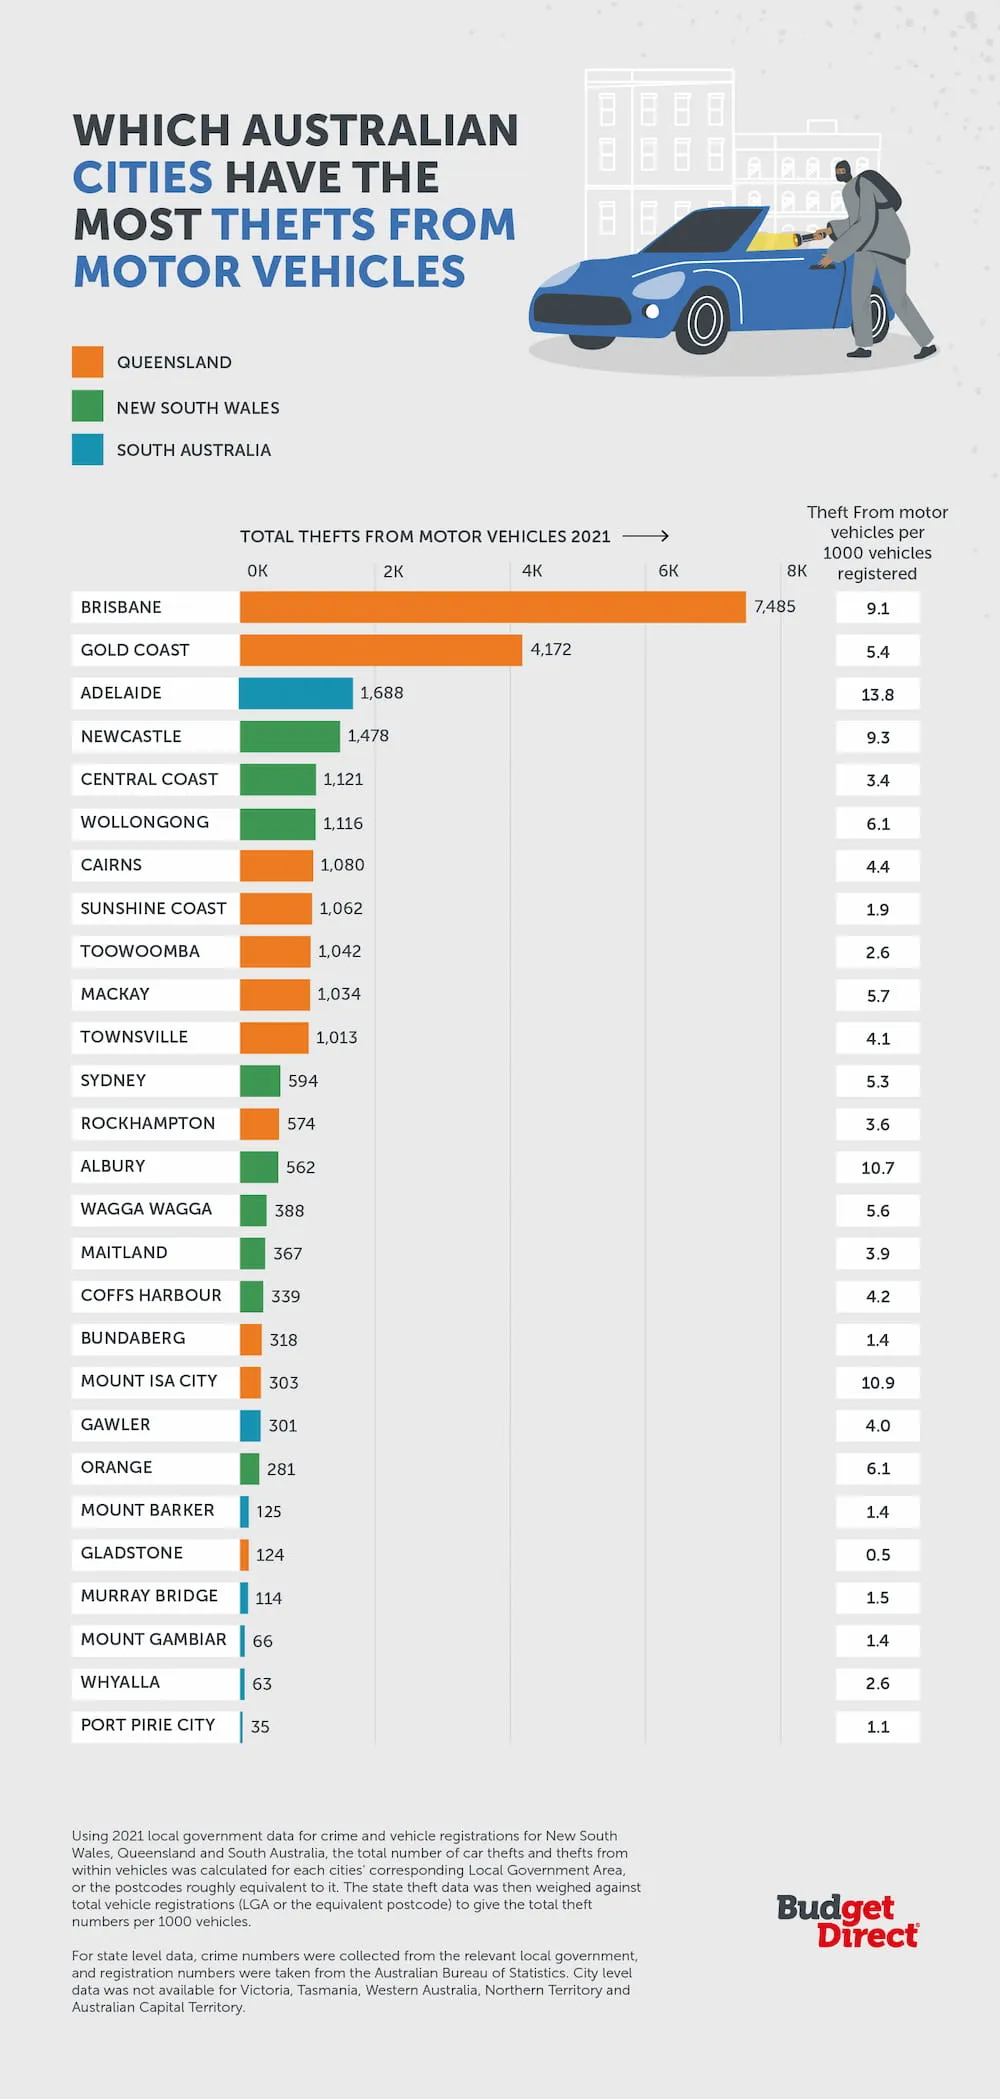
Tourist hot spot Sydney came 12th with a total of 1,116 reported thefts in 2021. When we look at the total number of vehicles registered, the Sunshine Coast, Queensland, has some of the highest numbers at 571,152, but has some of the lowest vehicle thefts per 1000 registered vehicles at 0.8, suggesting that vehicles are stolen less in this area.
What’s the total cost of motor vehicle theft from each state?
Using the National Motor Vehicle Theft Reduction Council (NMVTRC) data, we were able to extract the top motor vehicle models that are stolen nationally across the financial year of 20/21. The data showed that the Holden Commodore VE MY06_13 model has been stolen 898 times, with these thefts worth a total of $6,988,448 across the financial year.
The NMVTRC data also breaks down the top 20 models stolen in each state and their corresponding estimated total theft value. In order to calculate the total estimated cost of motor vehicle theft in each state, we divided the total theft value for each model by the total number of thefts across the financial year 2020/21.
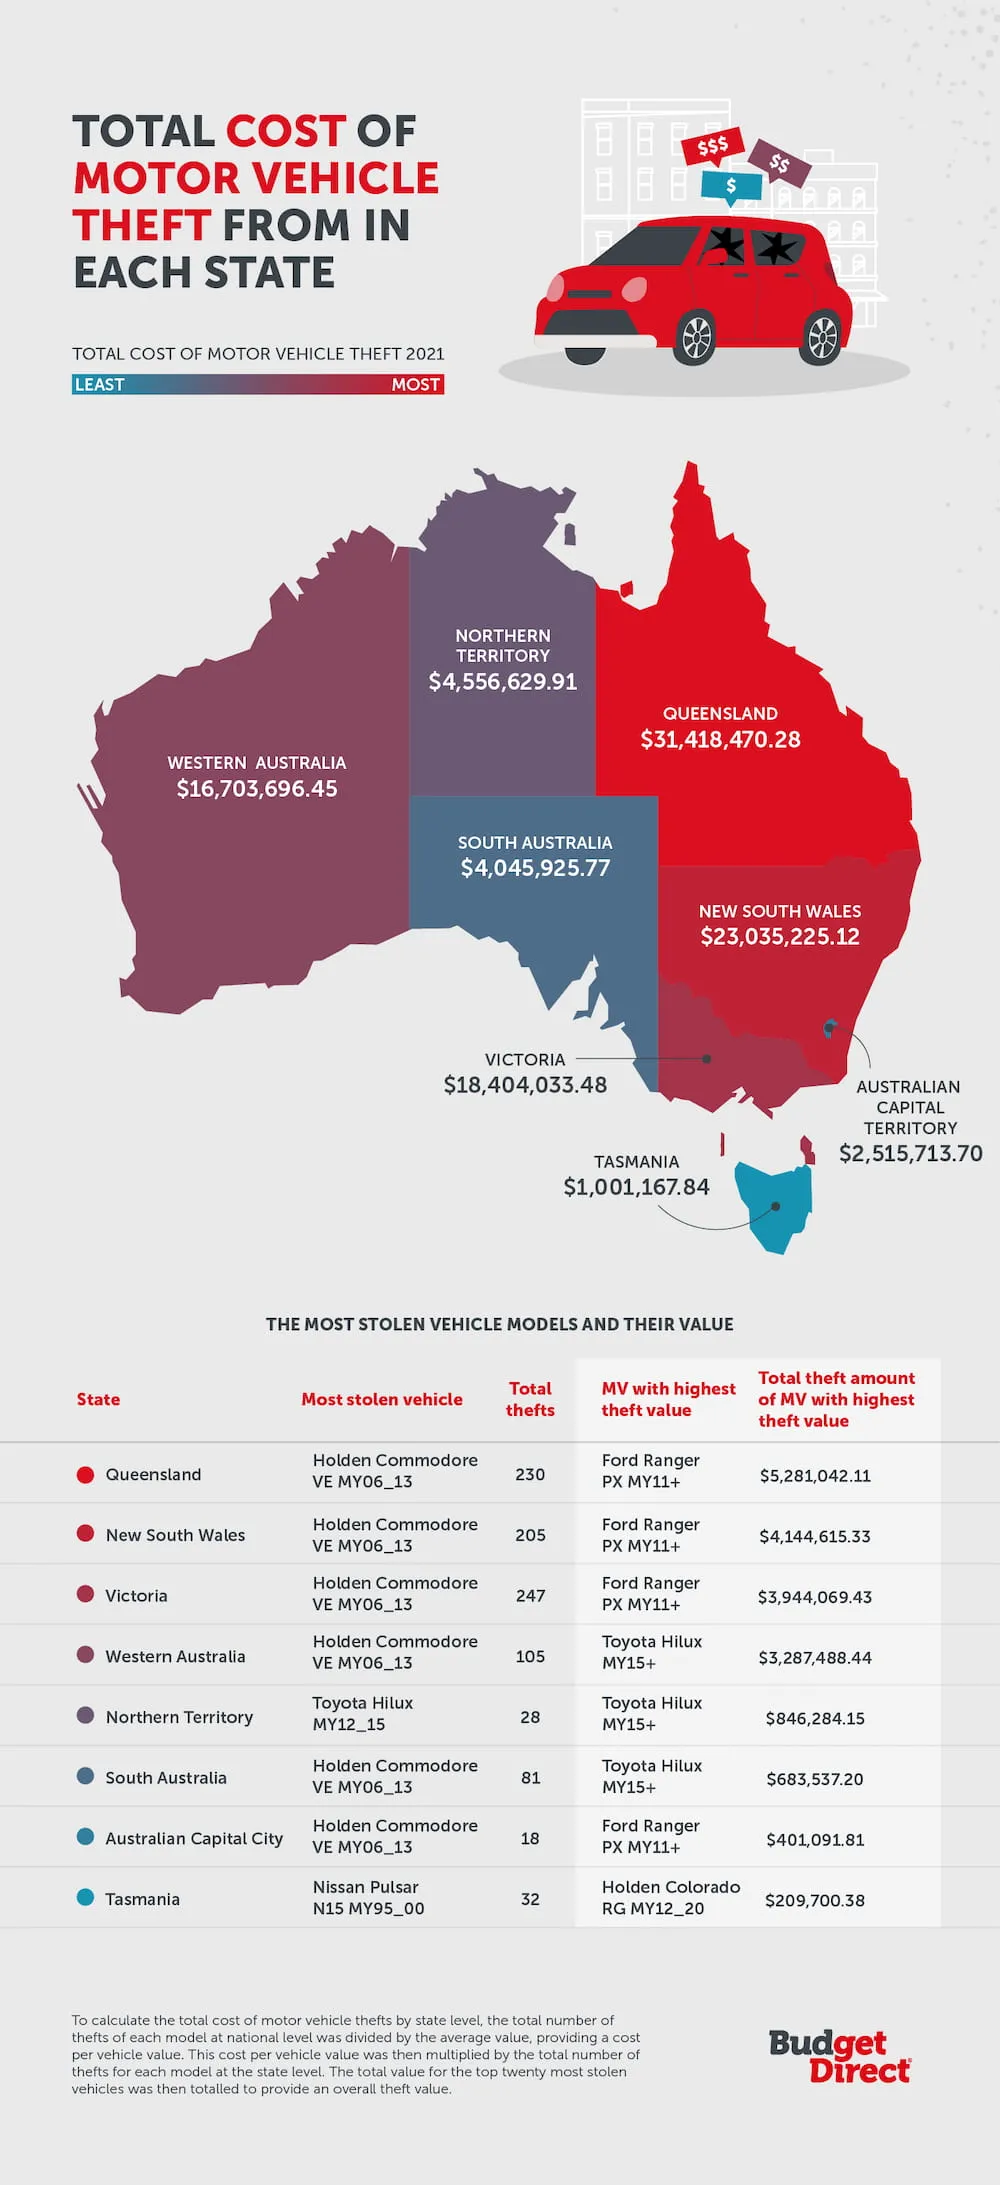
Queensland, the state with the most motor vehicle thefts, also had the highest total motor vehicle theft value, at $31,418,470.28.
As a warning for motor vehicle owners, the most stolen model is a Holden Commodore VE MY06_13 with 230 total thefts across the financial year (20/21). The model that’s been stolen with the highest theft value in Queensland is the Ford Ranger PX MY11+, a pickup truck, with the total number of thefts of this model equalling just over $5 million Australian dollars ($5,281,042.11). Owners of these models should take extra care to be vigilant of their property due the number of thefts.
The state with the lowest motor vehicle theft value is Tasmania. Approximately $1,001,167.84 worth of vehicles were stolen in the completed financial year 2020/21 and the most stolen model is a hatchback - the Nissan Pulsar N15 MY95_00.
Which time of the day and day of the week are motor vehicles stolen the most?
Australia’s national crime data also provides insight into which days of the week and the time of day that thieves are most likely to steal your car.
The data shows a common trend when the majority of thefts at state level happen towards the end of the week between Thursday and Saturday.
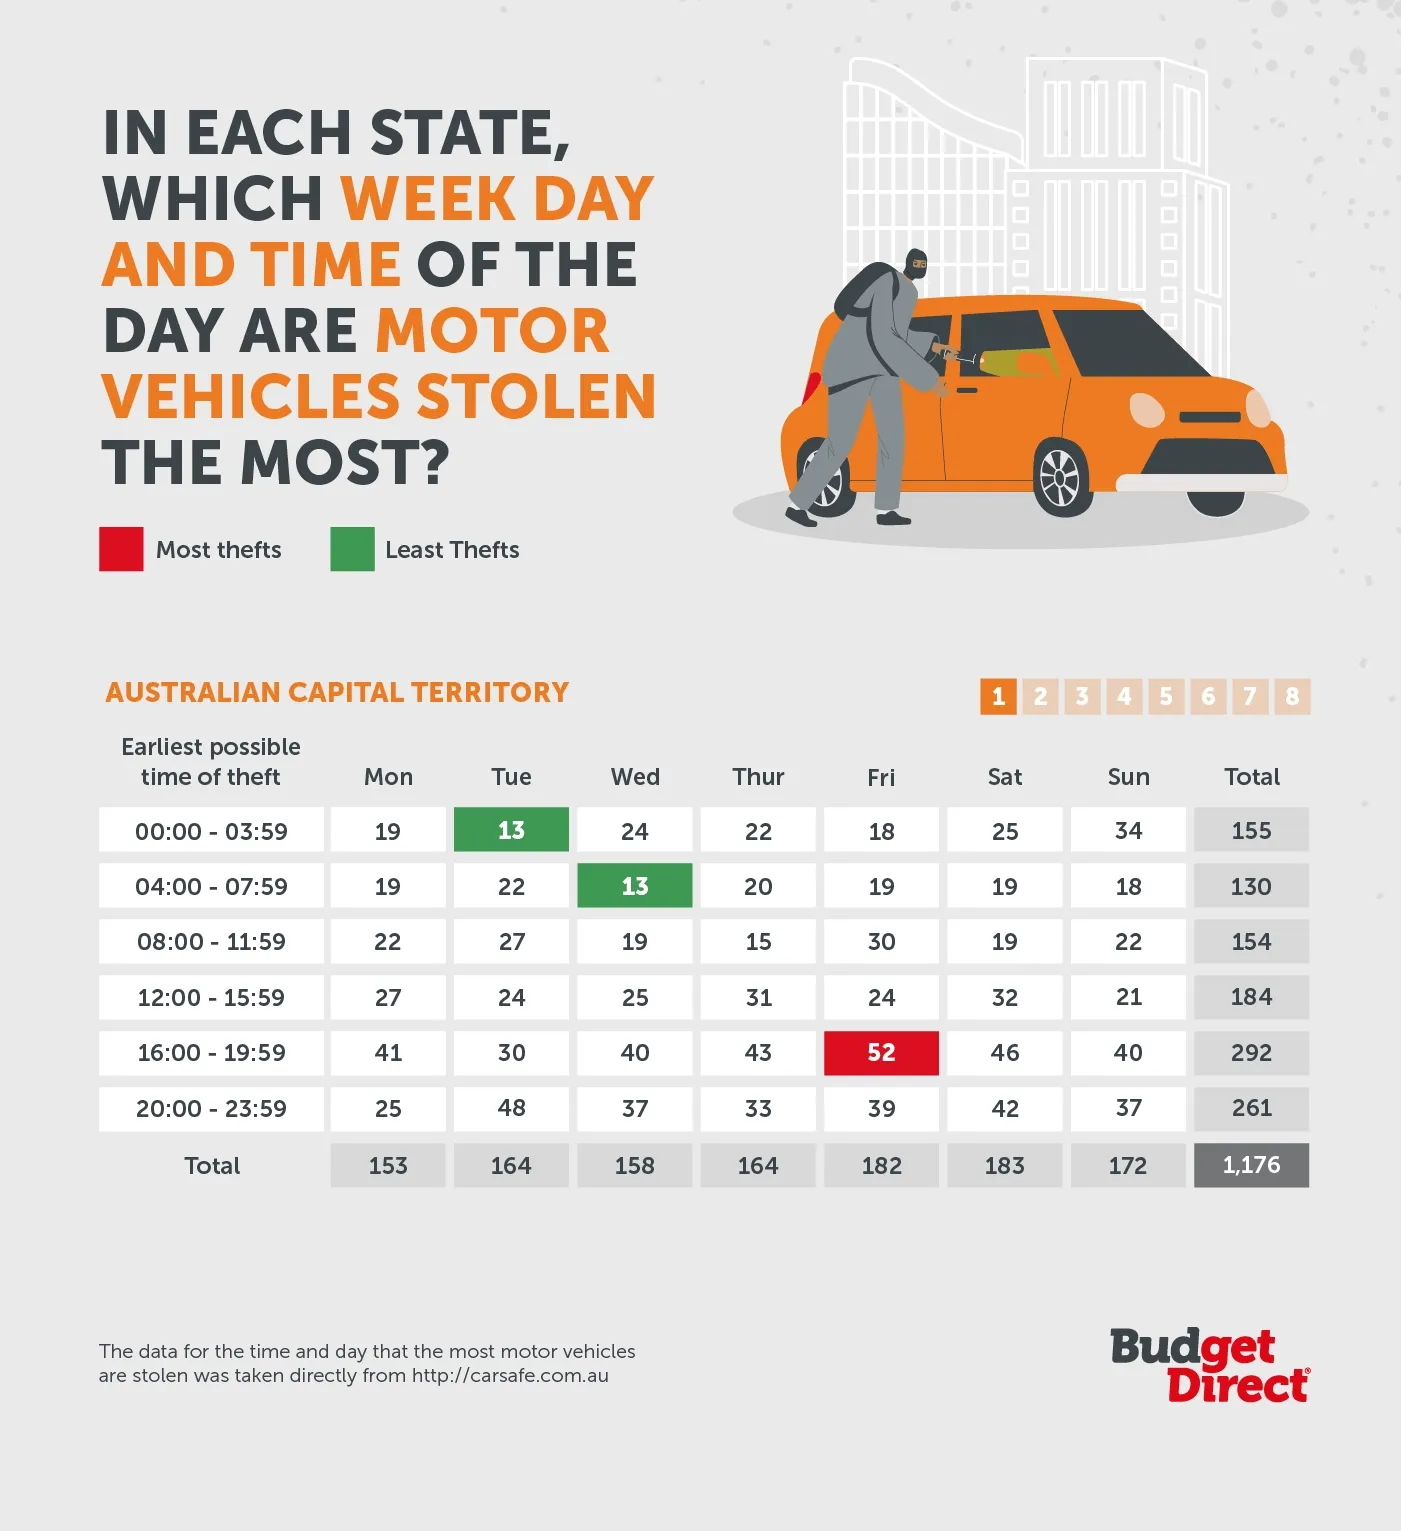
For motorists in the Australian Capital Territory, New South Wales, South Australia and Victoria, thieves are most likely to strike on a Friday between the hours of 16:00 - 19:59.
In the northern territory and Western Australia, the later hours on Friday between 20:00 - 23:59 is when the most motor vehicle thefts occur. Fridays could be a popular time for motor vehicle thieves as car owners may have headed out for the evening and not travelled in their own vehicle, which is most likely at their home address, making it an easier target as owners might not be nearby.
For Queensland, if a car is going to be stolen, the data shows that this will likely happen on a Saturday evening between the hours of 20:00 - 23:59. Again, the weekend hours are when thieves are most likely to strike!
In Tasmania, car theft levels are at their highest on a Thursday evening between 20:00 - 23:59, following a similar trend to the other states and territories where thieves operate under a cloak of darkness.
Whilst this data suggests when the majority of thefts occur, your motor vehicle could be stolen at any time. At a national level, the lowest levels of motor car thefts occurred between the early hours of 04:00 - 07:59 on a Sunday in the last financial year of 2020/21.
Having your vehicle stolen can have serious financial and emotional consequences on you and those around you, and although not always preventable, there are steps you can take to make your car more difficult to steal,
Increasing security inside and outside of your vehicle is a great physical deterrent. If a thief can see that your car is heavily protected with security cameras inside and out, motion sensors, tyre locks and anti-theft alarms, they’ll likely think twice before even attempting to steal your car. Our guide about how to protect yourself against car thefts shares additional information to get your property protected.
Another area to consider is your car insurance. Making sure your policy truly stacks up against the hassles and cost of theft is essential, so it’s worth considering whether your insurance includes a hire car to keep you getting from A to B. Recovery, towing and storage will also be crucial if your vehicle was damaged during a theft and needs to be recovered and repaired before returning to you.
Finally, you’ll want to check what the coverage is for damage and theft - it’s not just the valuable items stolen from your car that you’d like to cover, but also the damage done to the car itself and any items within it, such as a baby seat. Be sure to check out what your policy is on excess payments and what any additional excesses could be if you make a claim, as well as how much your insurer pays to help with theft of damage of your personal belongings. If you’re unclear on what excess means in your policy, take a look at our FAQ guide on what is excess in car insurance.
Disclaimer: This information is general in nature only. Budget Direct engaged Aira to conduct this research on Budget Direct’s behalf, and while Aira have taken all due care in providing the statistics from their research, Budget Direct accepts no liability for this information.
Sources
Methodology
Using 2021 local government data for crime and vehicle registrations for New South Wales, Queensland and South Australia, the total number of car thefts and thefts from within vehicles was calculated for each cities’ corresponding Local Government Area, or the postcodes equivalent to it. The state theft data was then weighed against total vehicle registrations (again, by LGA or equivalent postcode) to give the total theft numbers per 1000 vehicles.
For state level data, crime numbers were collected from the relevant local government, and registration numbers were taken from the Australian Bureau of Statistics. In some instances data was not available, as noted in the ‘Sources’ tab.
To calculate the total cost of motor vehicle thefts by state level, the total number of thefts of each model at national level was divided by the average value, providing a cost per vehicle value. This cost per vehicle value was then multiplied by the total number of thefts for each model at the state level. The total value for the top twenty most stolen vehicles was then totalled to provide an overall theft value.
The data for the time and day that the most motor vehicles are stolen was taken directly from the NMVTRC website resource.
Data
The full data set can be found here.
See More Road Safety Guides