
15 August 2021 | See disclaimer
Just how much damage do storms do each year? And how worried are Australians about their property being damaged? We’ve collected all the latest industry data and run our own survey research on storm damage to homes in Australia.
Quick Stats
- In the last 5 calendar years, over AU$20 billion has been lost to storms and flooding
- A 10cm hailstone can fall at over 140km/h
- Less than 30% of surveyed Australians aged 18-44 have an action plan ready if their home is threatened by a storm
- Almost 50% of Australians surveyed either don’t have home or contents insurance, or they aren’t sure of what their insurance actually covers regarding storm damage.
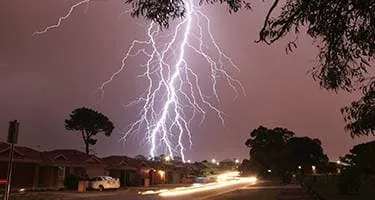
Storms are a natural part of Australian life. We know when summer rolls around, the threat of hail, cyclones, and strong winds increases significantly.
But just how many Australians experience damage to their homes from storms each year? And how much do storms actually cost Australians? We’ve dug through the science of storms, and conducted our own research to bring you:
1.0 Key Storm Risks in Australia
2.0 Australian Storm Statistics & Facts
2.1 Australian Losses from Storm Catastrophes 2016-2020
2.2 Highest Daily Rainfall Locations in Australia 2011-2020
2.3 State Temperatures in 2020
3.0 Australian Storm Survey Results
3.1 Which weather events have damaged your home and/or contents in the last 5 years?*
3.3 How often do you clear the gutters of debris?
4.0 How to Reduce your Risks of Losses from Storm Damage
1.0 Key Storm Risks in Australia
There are 4 common ways storms can threaten Australian properties:
Heavy Rain and Wind
While ’storms’ can feature a range of threats (such as flash-flooding or hail), the damage classified as ‘storm damage’ is usually due to rainfall, heavy winds, and lightning strikes. This damage can even be caused by belongings in your backyard (such as trampolines, sporting equipment, or furniture) that have been propelled through the air, striking either your property or neighbouring homes.
Flooding
‘Flood’ is defined as the covering of normally dry land by water that has escaped or been released from the normal confines of a lake, river, creek, or other natural watercourses (whether or not any of them have been altered or modified), or from a reservoir, canal, or dam. Flooding can either be triggered by intense rainfall in a single storm (often referred to as ‘flash flooding’) or could be from prolonged rain over several days/weeks.
Tornadoes
Despite common misconceptions, Australia has more than its fair share of tornadoes every year. The BoM [3] reports that dozens are sighted every year in Australia, with plenty more believed to go unspotted in rural/unpopulated areas. While they usually only feature in larger weather events (like bushfires or supercell storms), their high wind speeds still present severe damage and danger.
Cyclones
The northern regions of Australia would be rather familiar with the dangers of cyclones – with a typical 4-5 cyclones [1] making landfall in Australia each year. According to the Bureau of Meteorology (BoM) [2], the classification of ‘cyclone’ is given to a low-pressure storm when wind speeds of 34 knots or greater circle the eye of the storm, and persists for at least 6 hours.
2.0 Australian Storm Statistics & Facts
2.1 Australian Losses from Storm Catastrophes 2016-2020
The Insurance Council of Australia’s [4] historical catastrophe data shows the amount lost (in Australian dollars, normalised to 2017) to storm catastrophes from 2016 to 2020.
2.2 Highest Daily Rainfall Locations in Australia 2011-2020
| Year | Location | Daily rainfall (mm) |
|---|---|---|
| 2011 | Mornington Island, Qld | 477.2 |
| 2012 | Mount Jukes, Qld | 388.0 |
| 2013 | Numinbah, Qld | 653.0 |
| 2014 | Mount Bellenden Ker, Qld | 584.4 |
| 2015 | Mount Bellenden Ker, Qld | 433.7 |
| 2016 | Mount Bellenden Ker, Qld | 507.6 |
| 2017 | Mount Jukes, Qld | 635.0 |
| 2018 | Halifax, Qld | 678.0 |
| 2019 | Mossman, Qld | 562.0 |
| 2020 | Dum In Mirrie Island, NT | 562.0 |
For 9 straight years, the highest daily rainfall in a single day was measured in a Queensland town (according to the BoM [5]). However, 2020 broke the trend, with Dum In Mirrie Island claiming the annual record for the greatest daily rainfall.
2.3 State Temperatures in 2020
| State | Maximum temperature recorded | Mean temperature (compared to average) |
|---|---|---|
| QLD | 48.7°C (in Birdsville) | +1.4 °C above average (5th warmest year on record) |
| NSW | 48.9°C (in Penrith Lakes) | +0.9 °C above average |
| VIC | 46.2°C (in Kyabram) | +0.5 °C above average |
| SA | 48.0°C (in Andamooka) | +0.7 °C above average |
| WA | 48.2°C (in Eyre) | +1.5 °C above average (2nd warmest year on record) |
| TAS | 41.4°C (in Hobart Airport) | +0.3 °C above average |
| NT | 46.0°C (in Jervois) | +1.3 °C above average |
| ACT | 44.0°C (in Canberra Airport) | NA |
In 2020, every state/territory recorded mean temperatures above their own average. This shows that as time goes by, average temperatures are increasing.
There is growing consensus within the scientific community that higher temperatures lead to a greater number of severe weather events, such as cyclones, storms, and hail [6].
3.0 Australian Storm Survey Results
3.1 Which weather events have damaged your home and/or contents in the last 5 years?*
Type of home
| General storms (like heavy winds, lightning, or heavy rain) | Hail | Floods | Cyclones | Tornadoes | None of the above | |
|---|---|---|---|---|---|---|
| House | 32.8% | 14.3% | 10.1% | 1.9% | 0.9% | 57.4% |
| Townhouse/duplex | 31.1% | 12.6% | 16.8% | 6.7% | 0.8% | 58.0% |
| Unit/apartment | 19.7% | 6.4% | 5.8% | 1.7% | 3.5% | 73.4% |
| Grand Total | 30.0% | 12.8% | 10.1% | 2.5% | 1.5% | 60.5% |
State
| General storms (like heavy winds, lightning, or heavy rain) | Hail | Floods | Cyclones | Tornadoes | None of the above | |
|---|---|---|---|---|---|---|
| NSW | 34.4% | 12.3% | 16.5% | 1.5% | 1.8% | 55.4% |
| VIC | 29.0% | 13.1% | 6.2% | 1.9% | 1.2% | 63.3% |
| QLD | 27.1% | 16.4% | 8.9% | 5.6% | 1.9% | 61.2% |
| WA | 35.4% | 10.1% | 6.3% | 1.3% | 1.3% | 60.8% |
| SA | 21.1% | 5.6% | 4.2% | 2.8% | 1.4% | 70.4% |
| TAS | 33.3% | 4.2% | 12.5% | 0.0% | 0.0% | 58.3% |
| AUS | 30.0% | 12.8% | 10.1% | 2.5% | 1.5% | 60.5% |
Age
| General storms (like heavy winds, lightning, or heavy rain) | Hail | Floods | Cyclones | Tornadoes | None of the above | |
|---|---|---|---|---|---|---|
| 18-24 | 31.4% | 18.1% | 18.1% | 5.7% | 3.8% | 55.2% |
| 25-34 | 32.6% | 13.5% | 13.0% | 2.6% | 2.6% | 56.0% |
| 35-44 | 33.3% | 13.7% | 12.8% | 3.7% | 1.4% | 54.8% |
| 45-54 | 32.9% | 14.1% | 10.6% | 0.6% | 1.2% | 57.6% |
| 55-64 | 25.5% | 10.5% | 2.6% | 2.6% | 0.0% | 68.6% |
| 65+ | 22.5% | 8.1% | 4.4% | 0.6% | 0.6% | 72.5% |
| Total | 30.0% | 12.8% | 10.1% | 2.5% | 1.5% | 60.5% |
Gender
| General storms (like heavy winds, lightning, or heavy rain) | Hail | Floods | Cyclones | Tornadoes | None of the above | |
|---|---|---|---|---|---|---|
| Female | 28.6% | 11.0% | 8.2% | 2.2% | 1.4% | 63.4% |
| Male | 31.5% | 14.7% | 12.1% | 2.9% | 1.6% | 57.5% |
| Total | 30.0% | 12.8% | 10.1% | 2.5% | 1.5% | 60.5% |
*Users were able to select multiple weather events, meaning values may not add up to 100%.
Australians surveyed who live in houses seem the most likely to experience damage from general storms – such as those with heavy winds, lightning, or heavy rain. Hail also damages a greater proportion of houses than it does any other type of dwelling.
Townhouses and duplexes seem to take more damage from flooding than other types of properties. Units and apartments then seem to be the least damaged by the weather in general.
3.2 Does your household currently have an action plan in case of a severe storm or other natural disasters?
Type of home
State
Age
Gender
Queenslanders and Tasmanians seem the most prepared for storm season, with around 41% of each state indicating their household has an action plan in place.
Apartment-dwellers also tend to prepare less for storms and emergencies, with only 26% indicating they have a plan in place. This rose to over 33% of Australians who live in houses.
Younger Australians were also less likely to have a plan in place, with under 30% of those aged 18-44 indicating they were ready for a severe storm or natural disaster.
3.3 How often do you clear the gutters of debris?
Type of home
| At least once a quarter | At least once a year | At lease once every few years | Never | N/A (I don’t have gutters) | |
|---|---|---|---|---|---|
| House | 17.0% | 40.6% | 19.9% | 18.8% | 3.8% |
| Townhouse/duplex | 11.8% | 40.3% | 16.0% | 22.7% | 9.2% |
| Unit/apartment | 11.6% | 17.3% | 8.7% | 26.6% | 35.8% |
| Grand Total | 15.2% | 36.2% | 17.4% | 20.7% | 10.5% |
State
| At least once a quarter | At least once a year | At lease once every few years | Never | N/A (I don’t have gutters) | |
|---|---|---|---|---|---|
| NSW | 18.6% | 35.3% | 12.6% | 21.9% | 11.7% |
| Vic | 13.1% | 37.8% | 22.8% | 16.6% | 9.7% |
| Qld | 13.1% | 31.8% | 16.4% | 27.6% | 11.2% |
| WA | 8.9% | 46.8% | 17.7% | 20.3% | 6.3% |
| SA | 23.9% | 38.0% | 16.9% | 14.1% | 7.0% |
| Tas | 8.3% | 50.0% | 16.7% | 20.8% | 4.2% |
| Aus | 15.2% | 36.2% | 17.4% | 20.7% | 10.5% |
Age
| At least once a quarter | At least once a year | At lease once every few years | Never | N/A (I don’t have gutters) | |
|---|---|---|---|---|---|
| 18-24 | 13.3% | 28.6% | 18.1% | 30.5% | 9.5% |
| 25-34 | 11.9% | 31.6% | 19.7% | 23.8% | 13.0% |
| 35-44 | 16.0% | 32.4% | 21.9% | 21.0% | 8.7% |
| 45-54 | 14.7% | 35.9% | 17.6% | 19.4% | 12.4% |
| 55-64 | 20.3% | 39.2% | 14.4% | 15.7% | 10.5% |
| 65+ | 15.0% | 49.4% | 10.6% | 16.3% | 8.8% |
| Total | 15.2% | 36.2% | 17.4% | 20.7% | 10.5% |
Gender
| At least once a quarter | At least once a year | At lease once every few years | Never | N/A (I don’t have gutters) | |
|---|---|---|---|---|---|
| Female | 14.3% | 35.0% | 18.8% | 19.8% | 12.1% |
| Male | 16.2% | 37.4% | 16.0% | 21.7% | 8.8% |
| Total | 15.2% | 36.2% | 17.4% | 20.7% | 10.5% |
To little surprise, surveyed Australians who live in apartments or units are less likely to have gutters. But for apartment-dwellers that do have gutters, they are more likely to clean them out quarterly than most Australians who live in townhouses or houses. House-dwellers tended to be slightly more proactive when it comes to cleaning gutters than those in townhouses, indicating better storm preparedness.
Across the board, over 20% of Australians that have gutters never clean them. This is one of the main catalysts for storm damage to homes and properties, meaning a significant portion of Australians are leaving themselves at risk.
Remember that if you are going to clear gutters, make sure you do it safely. You can have someone hold the ladder, or even get a paid professional to assist.
3.4 If your home becomes uninhabitable due to a storm, what is the maximum time you could stay with friends or family?
Type of home
| A week | A month | 3 months | 6 months | A year | Longer than a year | N/A | |
|---|---|---|---|---|---|---|---|
| House | 18.0% | 23.8% | 13.0% | 9.6% | 5.1% | 15.7% | 14.9% |
| Townhouse/duplex | 17.6% | 23.5% | 13.4% | 7.6% | 4.2% | 17.6% | 16.0% |
| Unit/apartment | 17.3% | 22.5% | 9.2% | 4.6% | 7.5% | 16.2% | 22.5% |
| Grand Total | 17.6% | 23.3% | 12.3% | 8.4% | 5.5% | 16.3% | 16.6% |
State
| A week | A month | 3 months | 6 months | A year | Longer than a year | N/A | |
|---|---|---|---|---|---|---|---|
| NSW | 15.3% | 24.3% | 9.6% | 7.5% | 8.4% | 16.5% | 18.6% |
| VIC | 21.2% | 22.8% | 13.1% | 7.3% | 4.2% | 15.4% | 15.8% |
| QLD | 15.9% | 22.9% | 15.9% | 7.0% | 4.2% | 17.3% | 16.8% |
| WA | 20.3% | 25.3% | 8.9% | 11.4% | 3.8% | 15.2% | 15.2% |
| SA | 15.5% | 22.5% | 15.5% | 12.7% | 2.8% | 19.7% | 11.3% |
| TAS | 16.7% | 20.8% | 20.8% | 12.5% | 0.0% | 8.3% | 20.8% |
| AUS | 17.6% | 23.3% | 12.3% | 8.4% | 5.5% | 16.3% | 16.6% |
Age
| A week | A month | 3 months | 6 months | A year | Longer than a year | N/A | |
|---|---|---|---|---|---|---|---|
| 18-24 | 13.3% | 21.9% | 15.2% | 9.5% | 8.6% | 14.3% | 17.1% |
| 25-34 | 13.5% | 21.2% | 15.0% | 8.8% | 8.3% | 22.3% | 10.9% |
| 35-44 | 22.4% | 24.2% | 15.5% | 7.8% | 2.7% | 16.4% | 11.0% |
| 45-54 | 21.8% | 23.5% | 8.8% | 11.8% | 4.7% | 11.8% | 17.6% |
| 55-64 | 15.7% | 25.5% | 8.5% | 5.2% | 7.2% | 15.7% | 22.2% |
| 65+ | 16.3% | 23.1% | 10.0% | 7.5% | 3.1% | 15.6% | 24.4% |
| Total | 17.6% | 23.3% | 12.3% | 8.4% | 5.5% | 16.3% | 16.6% |
Gender
| A week | A month | 3 months | 6 months | A year | Longer than a year | N/A | |
|---|---|---|---|---|---|---|---|
| Female | 19.0% | 21.9% | 11.4% | 8.8% | 5.5% | 14.7% | 18.8% |
| Male | 16.2% | 24.7% | 13.3% | 8.0% | 5.5% | 18.0% | 14.3% |
| Total | 17.6% | 23.3% | 12.3% | 8.4% | 5.5% | 16.3% | 16.6% |
Australian seniors sampled seem to have the highest rates of not feeling like they could live with friends or family in the event their home becomes inhabitable due to storm damage. Almost 1 in 4 participants over 65 indicated they didn’t have an alternative, and around 40% suggested that the maximum time they could stay with someone is a month.
South Australians seem to have the best access to temporary accommodation with family, with almost 20% suggesting they could live with family and friends for over a year if need be.
3.5 Which of the following areas of cover do you have in your Home Insurance policy in the event your home became uninhabitable?*
Type of home
| Total contents cover | Total rebuild costs | Temporary accommodation | Partial rebuild costs | Not sure | I don’t have insurance | |
|---|---|---|---|---|---|---|
| House | 45.2% | 42.8% | 22.5% | 9.0% | 30.0% | 12.5% |
| Townhouse/duplex | 26.9% | 26.1% | 18.5% | 6.7% | 30.3% | 24.4% |
| Unit/apartment | 22.0% | 11.6% | 15.0% | 5.2% | 20.8% | 46.2% |
| Grand Total | 38.4% | 34.9% | 20.4% | 8.1% | 28.6% | 20.0% |
State
| Total contents cover | Total rebuild costs | Temporary accommodation | Partial rebuild costs | Not sure | I don’t have insurance | |
|---|---|---|---|---|---|---|
| NSW | 32.0% | 31.4% | 20.4% | 8.7% | 26.3% | 24.6% |
| VIC | 39.8% | 37.1% | 19.7% | 9.3% | 29.0% | 18.5% |
| QLD | 38.8% | 32.7% | 15.9% | 6.5% | 32.2% | 17.8% |
| WA | 44.3% | 36.7% | 22.8% | 7.6% | 30.4% | 17.7% |
| SA | 52.1% | 45.1% | 31.0% | 5.6% | 23.9% | 14.1% |
| TAS | 45.8% | 41.7% | 25.0% | 8.3% | 29.2% | 16.7% |
| AUS | 38.4% | 34.9% | 20.4% | 8.1% | 28.6% | 20.0% |
Age
| Total contents cover | Total rebuild costs | Temporary accommodation | Partial rebuild costs | Not sure | I don’t have insurance | |
|---|---|---|---|---|---|---|
| 18-24 | 21.9% | 17.1% | 10.5% | 5.7% | 38.1% | 26.7% |
| 25-34 | 28.5% | 22.8% | 16.1% | 10.9% | 30.1% | 24.9% |
| 35-44 | 33.8% | 32.9% | 17.4% | 10.5% | 31.1% | 20.1% |
| 45-54 | 43.5% | 37.1% | 26.5% | 8.2% | 23.5% | 18.8% |
| 55-64 | 47.7% | 43.1% | 21.6% | 4.6% | 28.8% | 15.7% |
| 65+ | 53.1% | 53.8% | 28.8% | 6.3% | 22.5% | 15.0% |
| Total | 38.4% | 34.9% | 20.4% | 8.1% | 28.6% | 20.0% |
Gender
| Total contents cover | Total rebuild costs | Temporary accommodation | Partial rebuild costs | Not sure | I don’t have insurance | |
|---|---|---|---|---|---|---|
| Female | 35.4% | 30.9% | 17.2% | 5.7% | 31.3% | 21.9% |
| Male | 41.5% | 39.1% | 23.7% | 10.6% | 25.8% | 18.0% |
| Total | 38.4% | 34.9% | 20.4% | 8.1% | 28.6% | 20.0% |
*Users were able to select multiple answers, meaning values may not add up to 100%.
House-dwellers in our study have the highest rates of having insurance, with only 12.5% indicating they didn’t have any level of coverage. This differed wildly from unit or apartment dwellers, where over 46% said they didn’t have insurance.
Younger Australians were the most likely to be uninsured, with a very linear trend showing as Australians get older, their odds of having insurance on their home or contents increases proportionally.
New South Wales also had the highest rate of being uninsured – being almost a quarter of residents. Over 50% of New South Wales respondents either didn’t know what their coverage was or had no insurance at all.
3.6 If a neighbour’s trampoline was to damage your property during a storm, who do you believe would be liable?
Type of home
State
Age
Gender
The most interesting finding is that Australians are reasonably unsure of where the fault lies if a trampoline is moved by a storm and damages a neighbour’s property. Circumstances will vary, but generally speaking, a trampoline being shifted is an unforeseeable event, meaning that the person who owns the trampoline won’t be liable.
However, over 52% of Australians feel the fault should lie with who owns the trampoline. This rose to almost 60% of Australians aged over 65.
3.7 If a neighbour’s tree was to fall and damage your property during a storm, who do you believe would be liable?
Type of home
State
Age
Gender
Participants in our study have very similar perceptions of a tree falling as a trampoline being shifted in the wind. However, the critical point to consider is whether the owner of the tree has properly maintained it and minimised the risk of damage being caused.
If the owner of the tree has neglected branches or roots that could foreseeably cause damage during a storm, they would generally be liable for the damage. So in that sense, over 50% of our survey participants were correct. However, the key finding again is the lack of certainty Australians have around who is at fault in storm-related insurance claims.
4.0 How to Reduce your Risks of Losses from Storm Damage
Clean Gutters
It sounds simple, but this is one of the best ways to minimise damage to your home from storms and rainwater. Blocked gutters can send rainwater where it doesn’t belong, seeping into your ground, roof, ceiling, walls, and plenty of other unideal places.
A few minutes here and there can save you a world of trouble during storm season.
Check your Roof Regularly, and Fix any Damage
It’s your job to make sure no gaps or damage could let water in. So as a routine, it’s worth checking the roof is all in working order. You can even start by going through the roof cavity (above the manhole) and checking if you can see any sunlight.
If you do spot some damage (whether it’s a gap, rust, or discolouration), make sure you take the right steps to repair it. No matter what kind of damage you’re looking at, the sooner you deal with it, the better.
Get Weather Warnings
The Bureau of Meteorology issues weather warnings before potentially serious storms strike. If you know what’s coming, you can ensure no loose objects are lying around the yard, your windows are shut, and the chances of damage from a storm are minimised.
See More Research